Matplotlib でサブプロット サイズを調整する方法
次の構文を使用して、Matplotlib のサブプロットのサイズを調整できます。
 #specify one size for all subplots
fig, ax = plt. subplots (2, 2, figsize=(10,7))

#specify individual sizes for subplots
fig, ax = plt. subplots (1, 2, gridspec_kw={' width_ratios ': [3, 1]})
次の例は、この構文を実際に使用する方法を示しています。
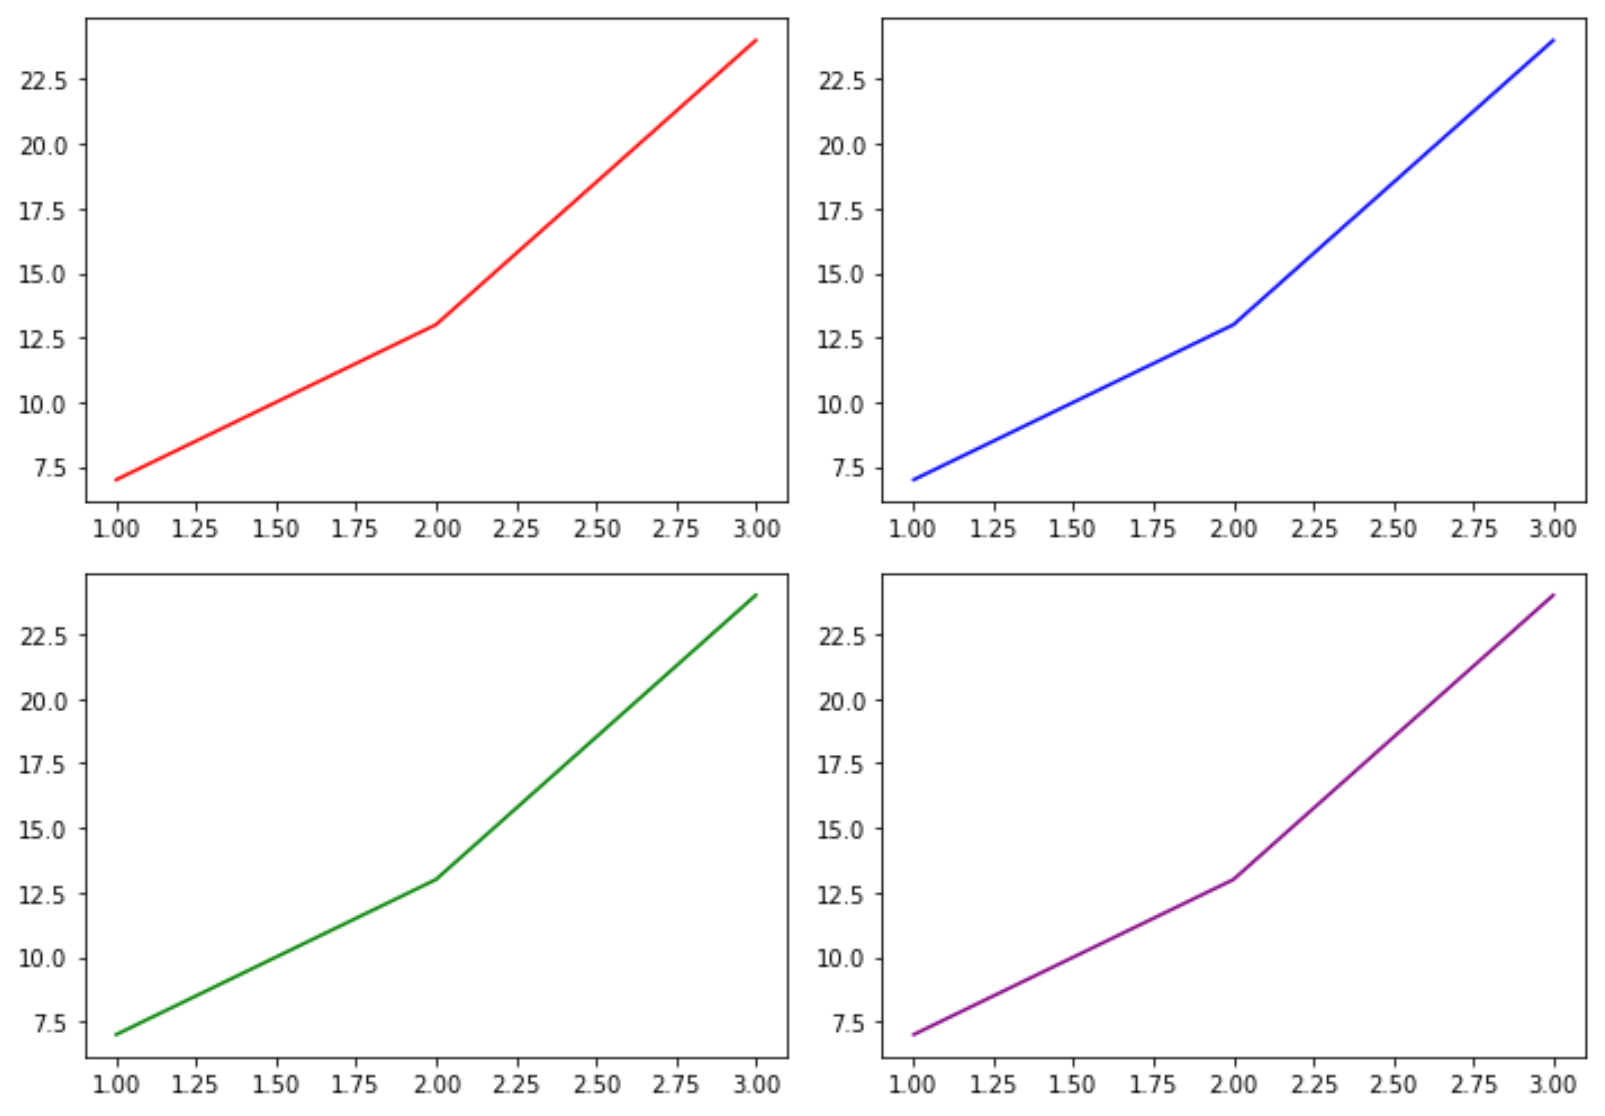
例 1: すべてのサブプロットのサイズを指定する
次のコードは、すべてのサブプロットのサイズを指定する方法を示しています。
 import matplotlib. pyplot as plt

#define subplots
fig, ax = plt. subplots (2, 2, figsize=(10,7))
fig. tight_layout ()

#define data
x = [1, 2, 3]
y = [7, 13, 24]

#create subplots
ax[0, 0]. plot (x,y,color=' red ')
ax[0, 1]. plot (x,y,color=' blue ')
ax[1, 0]. plot (x,y,color=' green ')
ax[1, 1]. plot (x,y,color=' purple ')
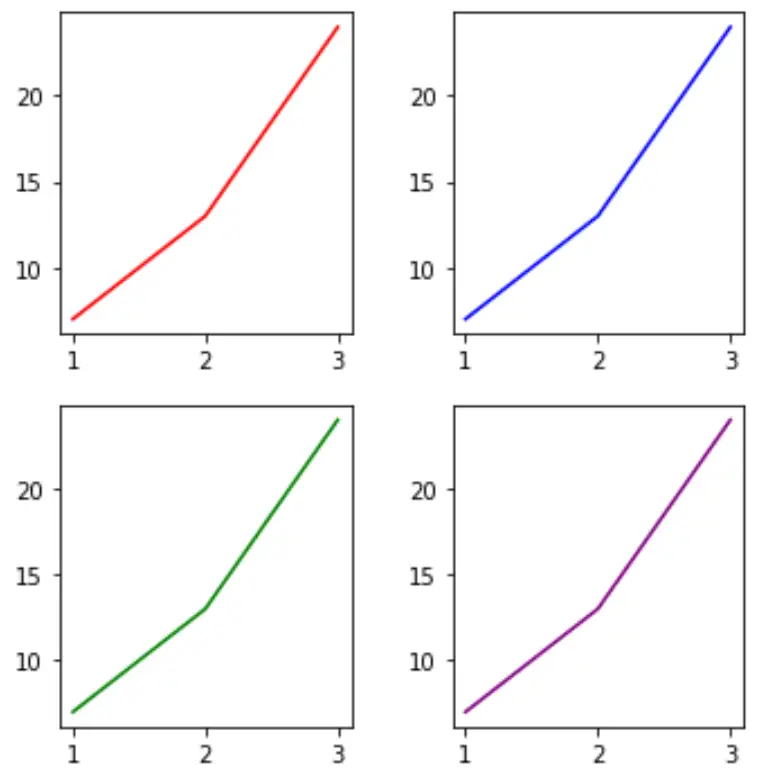
figsize引数の値を変更することで、サブトレースのサイズを簡単に変更できます。
 import matplotlib. pyplot as plt

#define subplots
fig, ax = plt. subplots (2, 2, figsize=(5,5))
fig. tight_layout ()

#define data
x = [1, 2, 3]
y = [7, 13, 24]

#create subplots
ax[0, 0]. plot (x,y,color=' red ')
ax[0, 1]. plot (x,y,color=' blue ')
ax[1, 0]. plot (x,y,color=' green ')
ax[1, 1]. plot (x,y,color=' purple ')
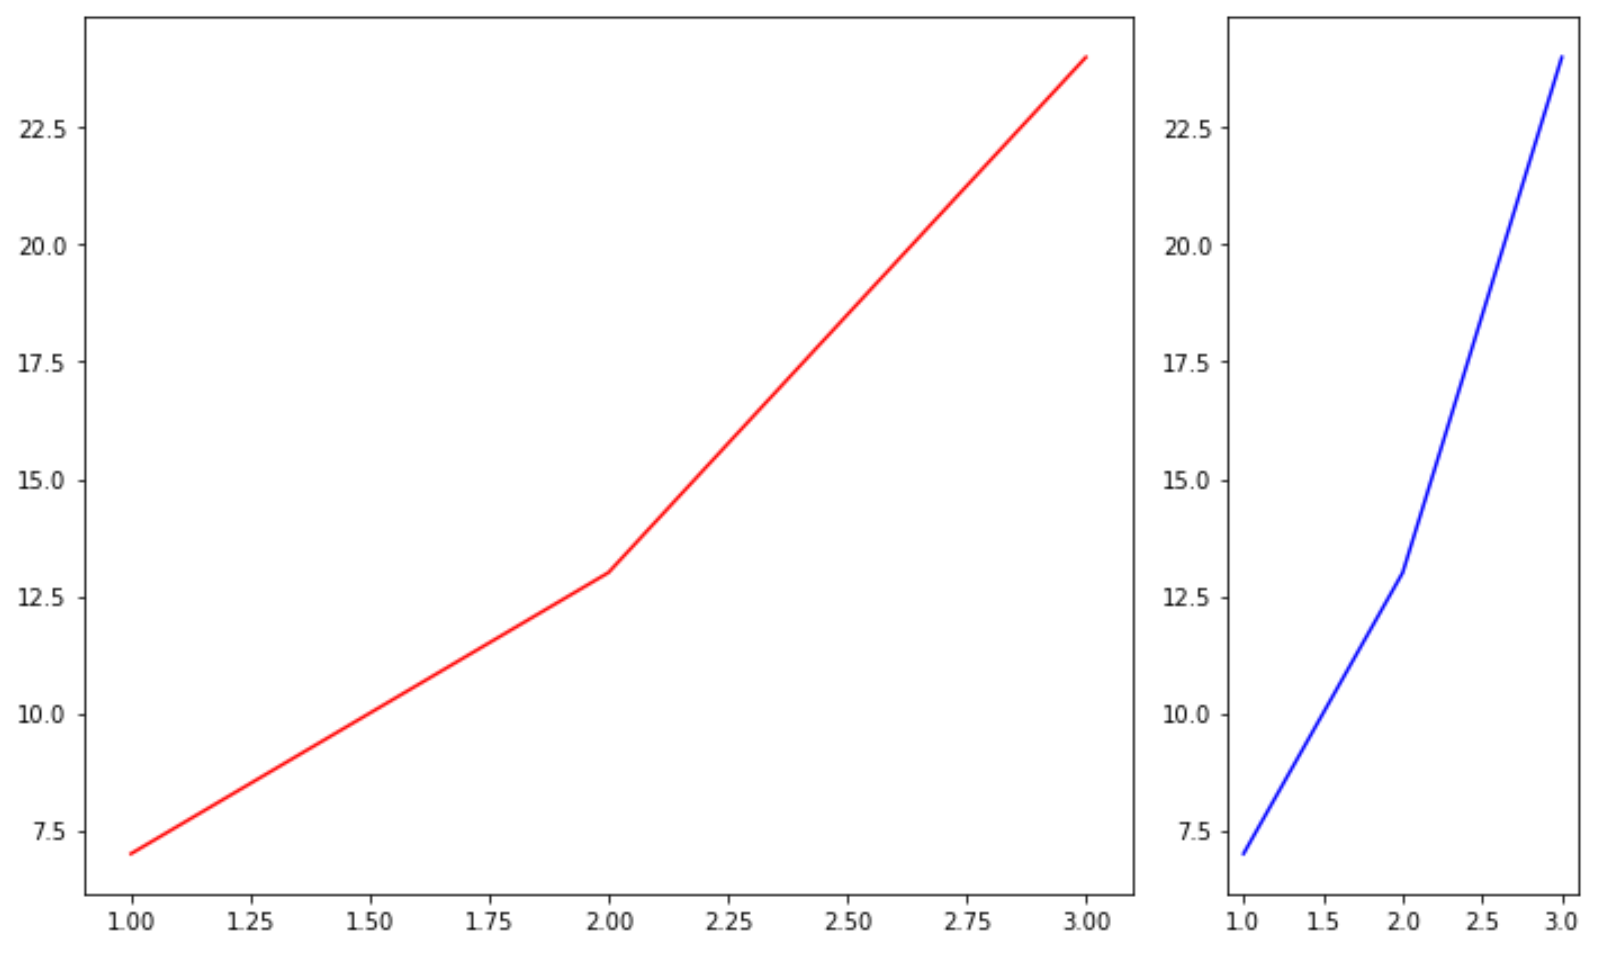
例 2:個々のサブプロットのサイズを指定する
次のコードは、個々のサブプロットに異なるサイズを指定する方法を示しています。
 import matplotlib. pyplot as plt

#define subplots
fig, ax = plt. subplots (1, 2, gridspec_kw={' width_ratios ': [3, 1]})
fig. tight_layout ()

#define data
x = [1, 2, 3]
y = [7, 13, 24]

#create subplots
ax[0]. plot (x,y,color=' red ')
ax[1]. plot (x,y,color=' blue ')
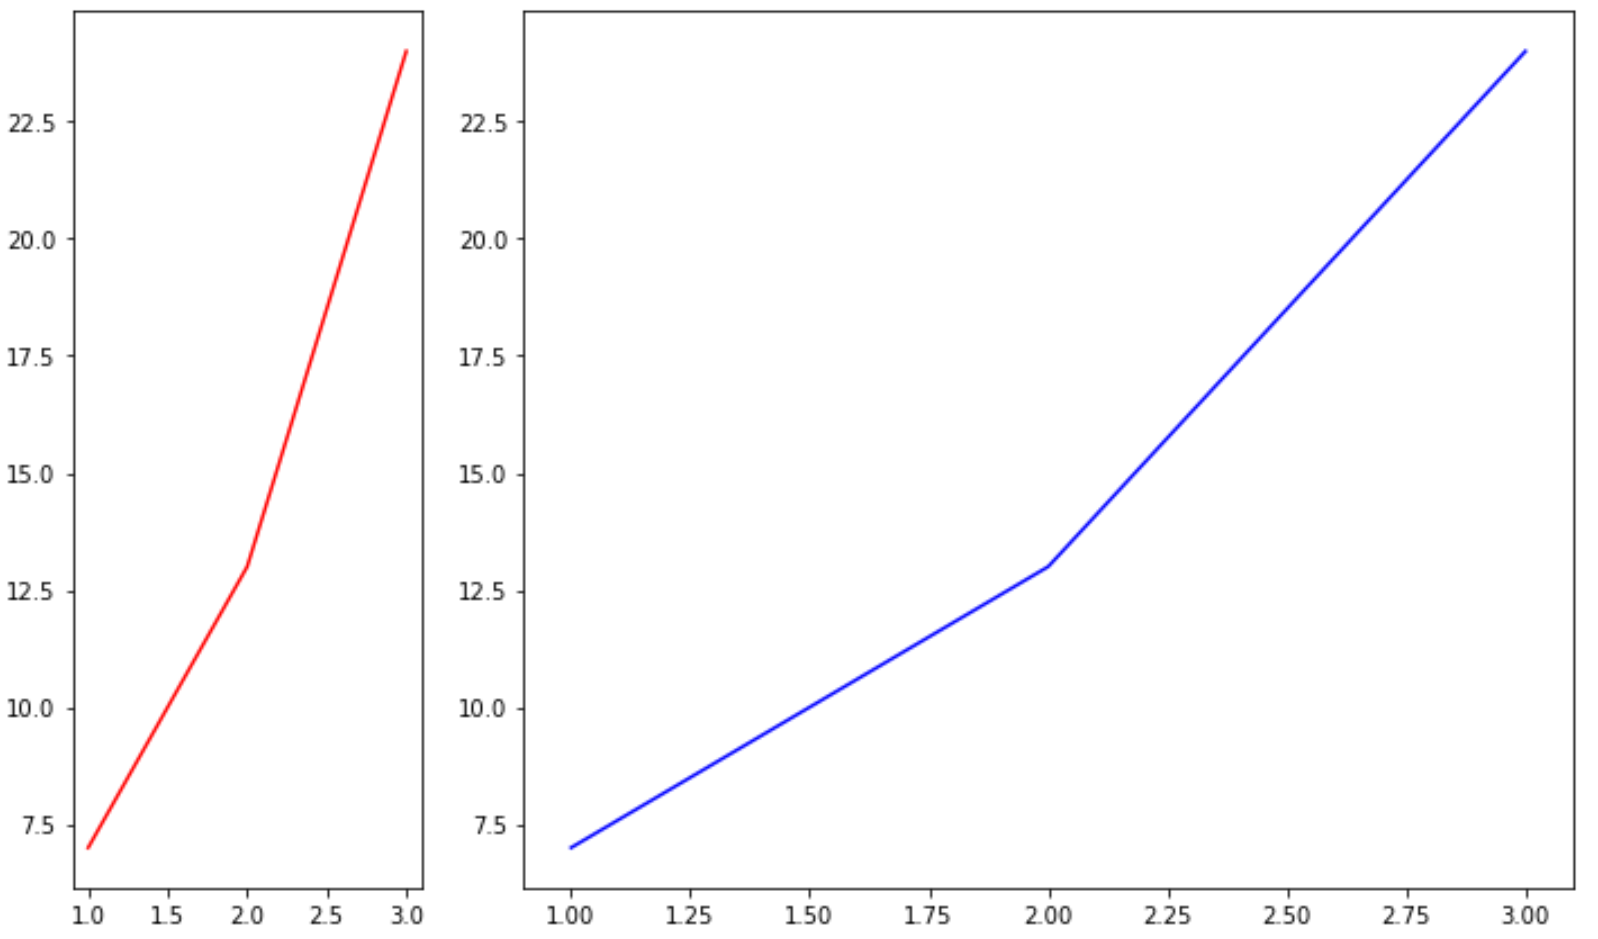
width_ratios引数の値を変更することで、サブトレースのサイズを簡単に変更できます。
 import matplotlib. pyplot as plt

#define subplots
fig, ax = plt. subplots (1, 2, gridspec_kw={' width_ratios ': [1, 3]})
fig. tight_layout ()

#define data
x = [1, 2, 3]
y = [7, 13, 24]

#create subplots
ax[0]. plot (x,y,color=' red ')
ax[1]. plot (x,y,color=' blue ')
追加リソース
Matplotlib でプロットにタイトルを追加する方法
Matplotlib で軸範囲を設定する方法
MatplotlibでX軸の値を設定する方法
著者について
ベンジャミン・アンダーソン博士
私はベンジャミンです。退職した統計教授から、専任の Statorials 教育者になりました。 統計分野における豊富な経験と専門知識を活かして、私は Statorials を通じて学生に力を与えるために自分の知識を共有することに尽力しています。もっと知る