Matplotlib figure をファイルに保存する方法 (例付き)
次の基本構文を使用して、Matplotlib Figure をファイルに保存できます。
 import matplotlib. pyplot as plt

#save figure in various formats
plt. savefig (' my_plot.png ')
plt. savefig ( ' my_plot.jpg ')
plt. savefig ( ' my_plot.pdf ')
次の例は、この構文を実際に使用する方法を示しています。
例 1: Matplotlib Figure を PNG ファイルに保存する
次のコードは、Matplotlib Figure を PNG ファイルに保存する方法を示しています。
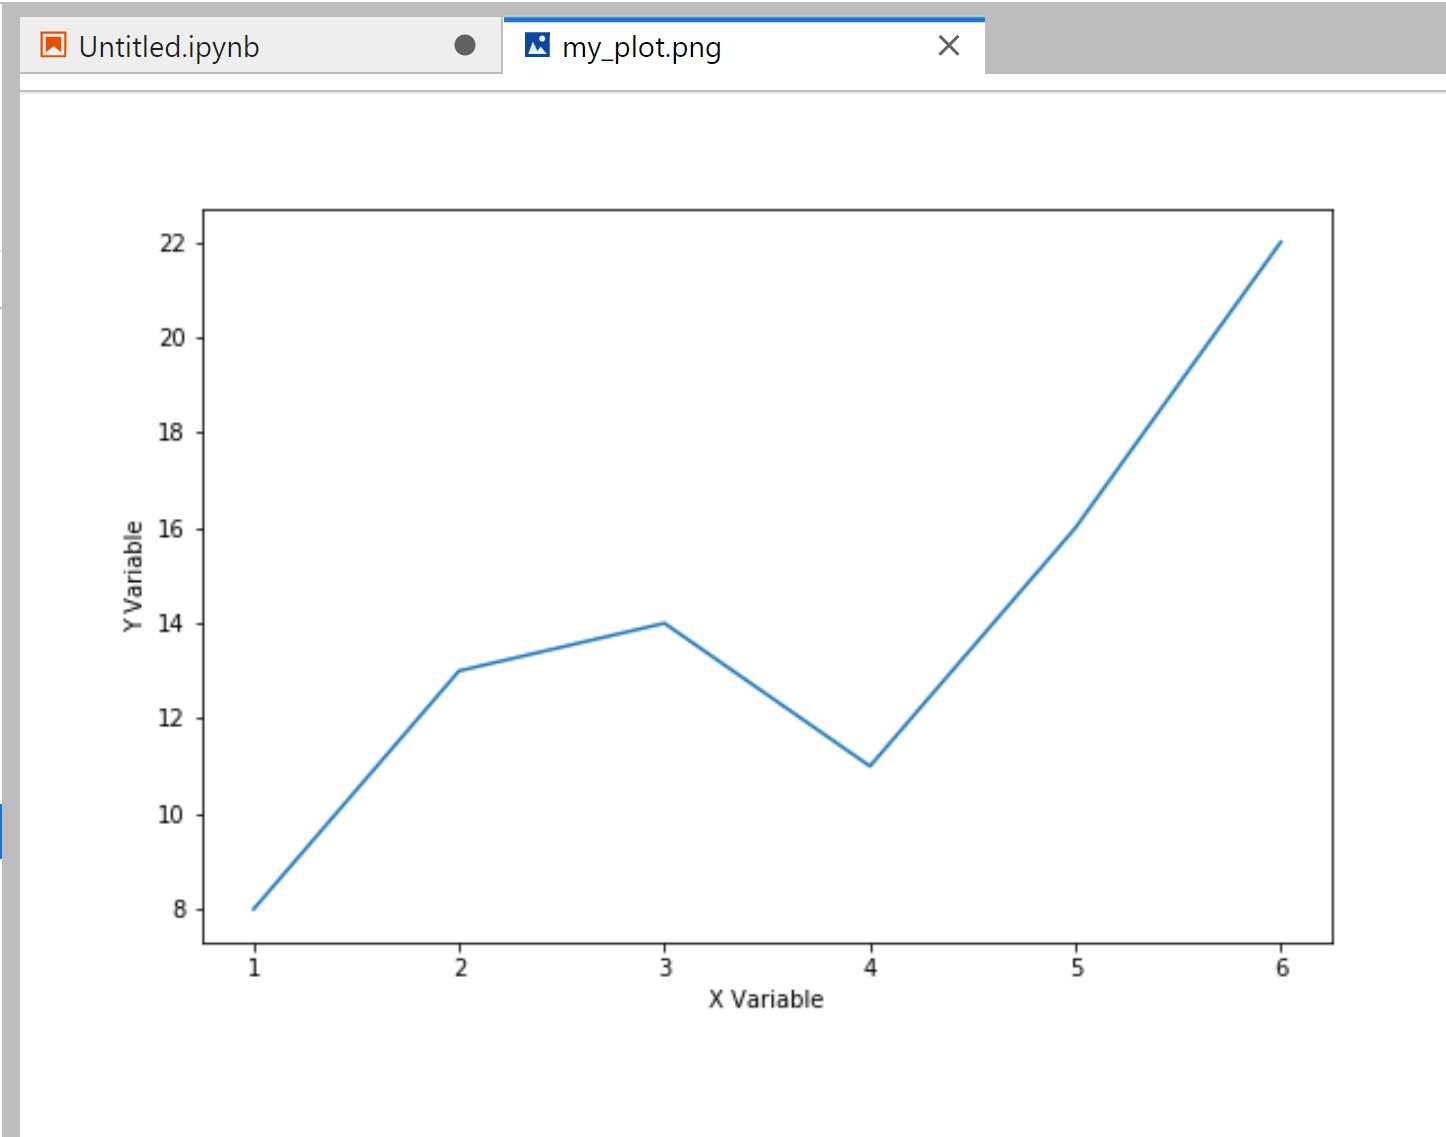
 import matplotlib. pyplot as plt

#define data
x = [1, 2, 3, 4, 5, 6]
y = [8, 13, 14, 11, 16, 22]

#create scatterplot with axis labels
plt. plot (x, y)
plt. xlabel (' XVariable ')
plt. ylabel (' Y Variable ')

#save figure to PNG file
plt. savefig (' my_plot.png ')
ファイルを保存した場所に移動すると、ファイルを表示できます。
例 2: タイトなレイアウトで Matplotlib Figure を保存する
デフォルトでは、Matplotlib は Figure の外側に十分なパディングを追加します。
このパディングを削除するには、 bbox_inches=’tight’引数を使用します。
 #save figure to PNG file with no padding
plt. savefig (' my_plot.png ', bbox_inches=' tight ')
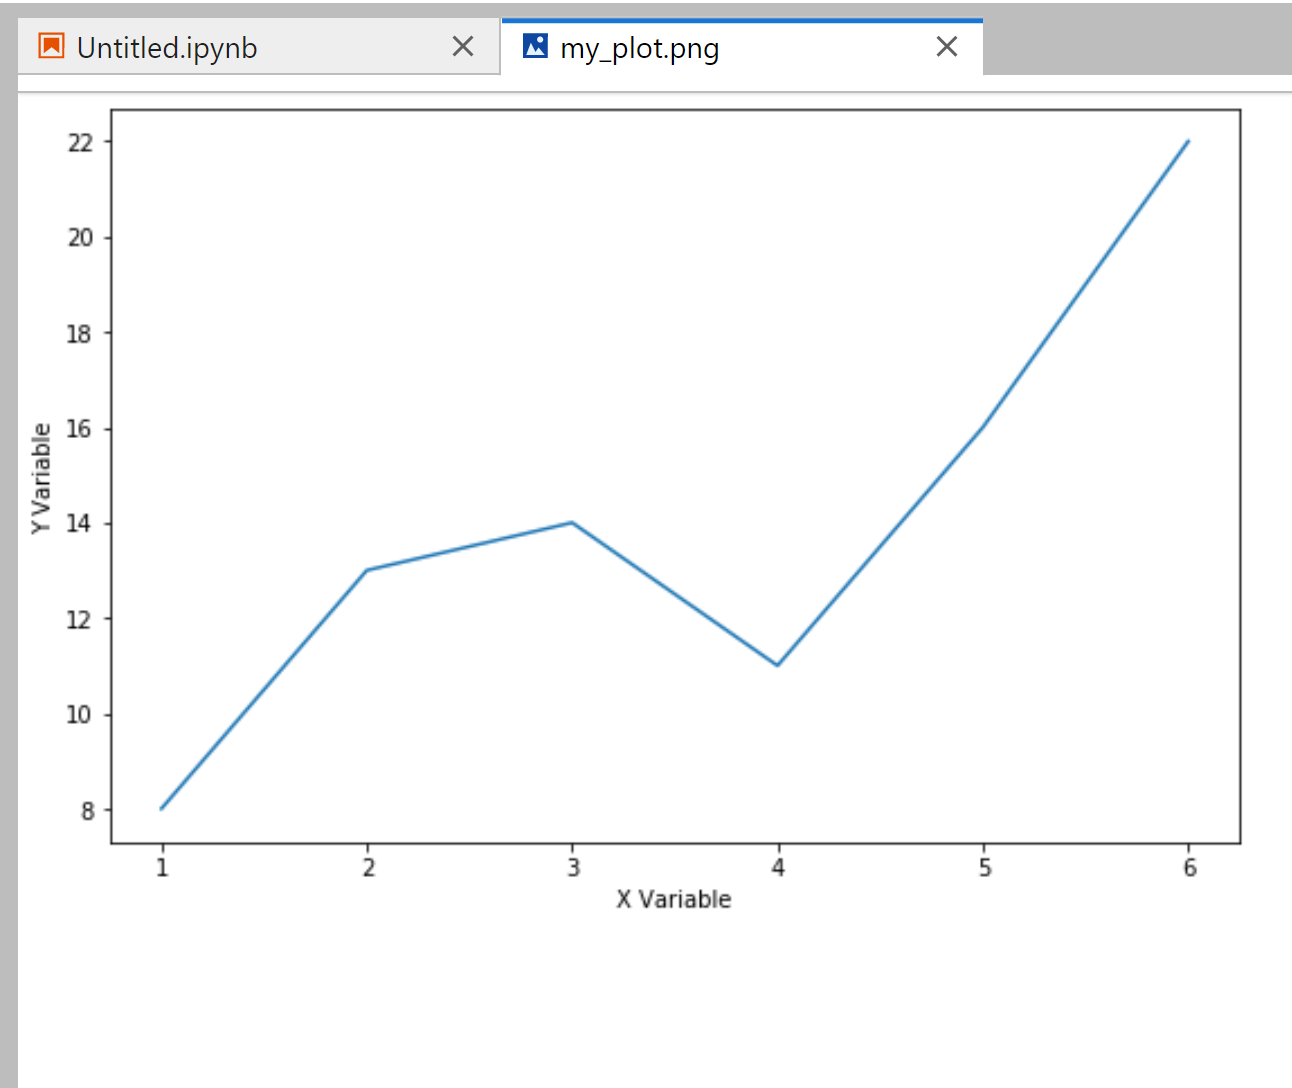
プロットの外側には充填物が少ないことに注意してください。
例 3: Matplotlib Figure をカスタム サイズで保存する
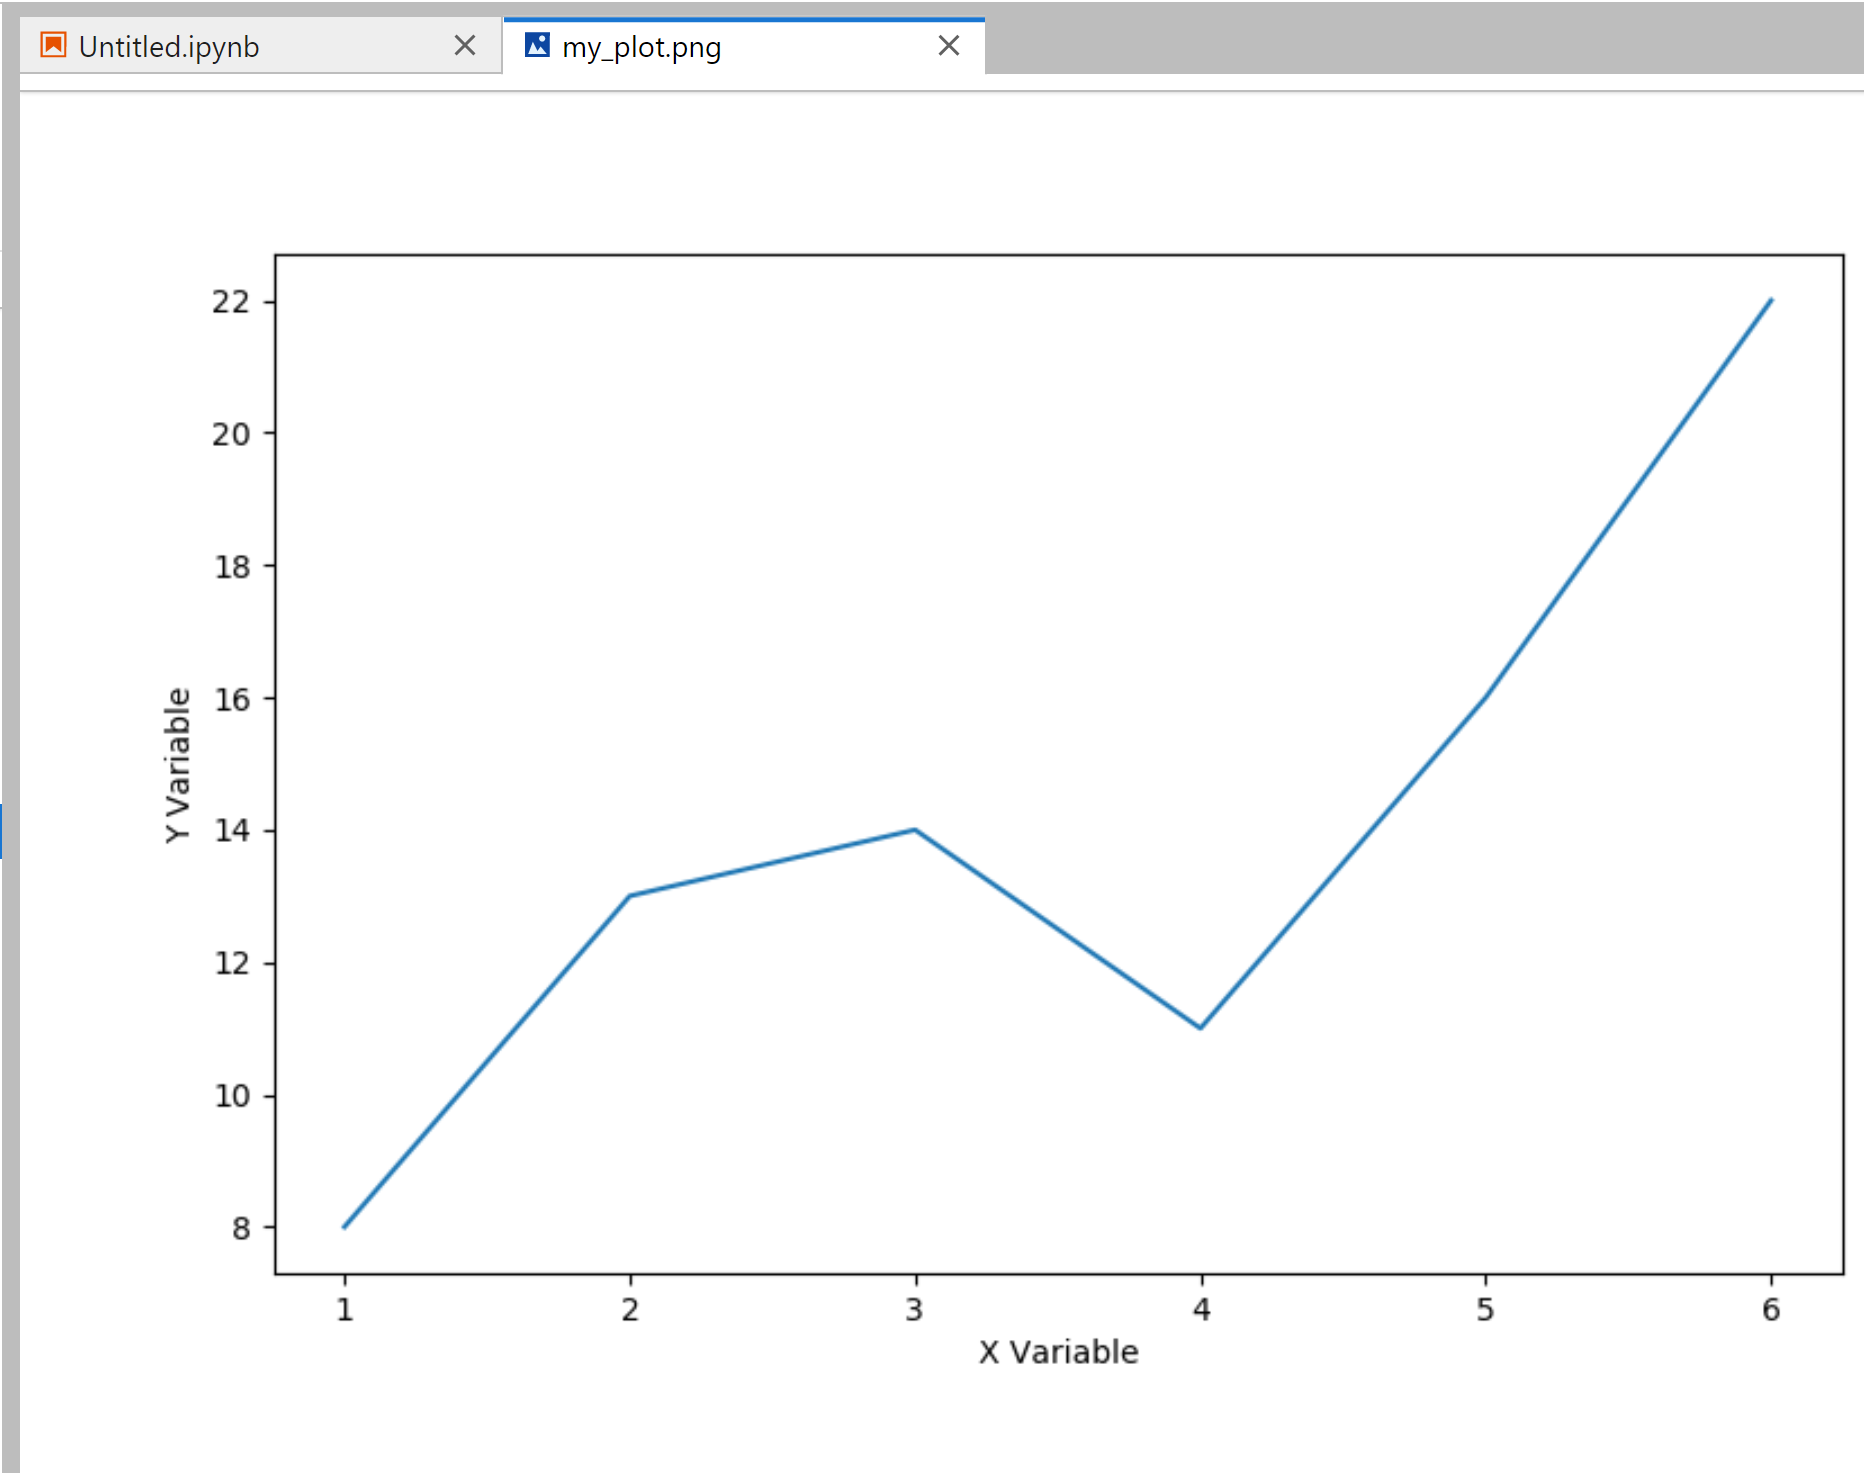
dpi引数を使用して、Matplotlib Figure を保存するときにそのサイズを増やすこともできます。
 #save figure to PNG file with increased size
plt. savefig (' my_plot.png ', dpi= 100 )
Matplotlib savefig()関数の完全なオンライン ドキュメントは、ここで見つけることができます。
追加リソース
次のチュートリアルでは、Matplotlib で他の一般的な関数を実行する方法を説明します。
Matplotlib で軸範囲を設定する方法
Matplotlib でプロット サイズを増やす方法
単一の Figure 上に複数の Matplotlib プロットを作成する方法
著者について
ベンジャミン・アンダーソン博士
私はベンジャミンです。退職した統計教授から、専任の Statorials 教育者になりました。 統計分野における豊富な経験と専門知識を活かして、私は Statorials を通じて学生に力を与えるために自分の知識を共有することに尽力しています。もっと知る