Matplotlib で行間の領域を埋める方法
次の関数を使用すると、Matplotlib プロット内の値の間の領域を簡単に埋めることができます。
- fill_between() : 2 つの水平曲線の間の領域を塗りつぶします。
- fill_betweenx() : 2 つの縦断曲線の間の領域を塗りつぶします。
このチュートリアルでは、これらの各関数を実際に使用する方法の例を示します。
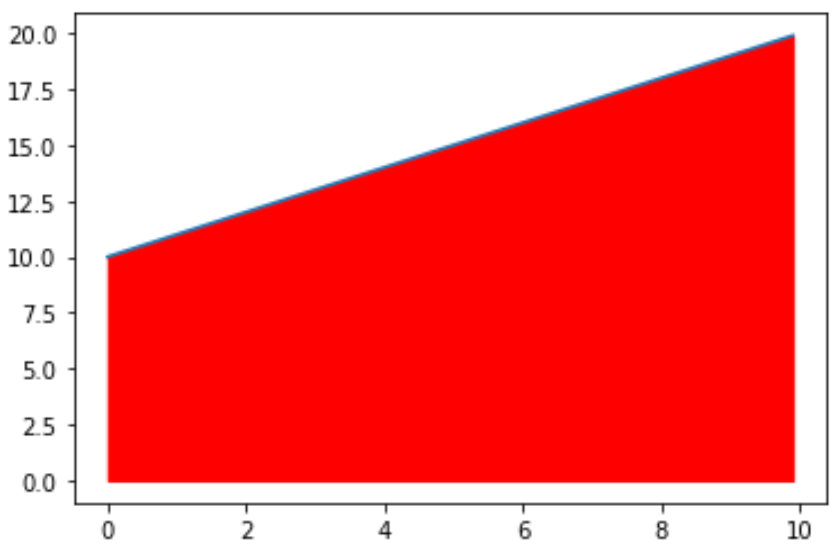
例 1: 2 本の水平線の間の領域を塗りつぶします。
次のコードは、2 本の水平線の間の領域を塗りつぶす方法を示しています。
 import matplotlib. pyplot as plt
import numpy as np

#define x and y values
x = np. arange (0,10,0.1)
y = np. arange (10,20,0.1)

#create plot of values
plt. plot (x,y)

#fill in area between the two lines
plt. fill_between (x,y,color=' red ')
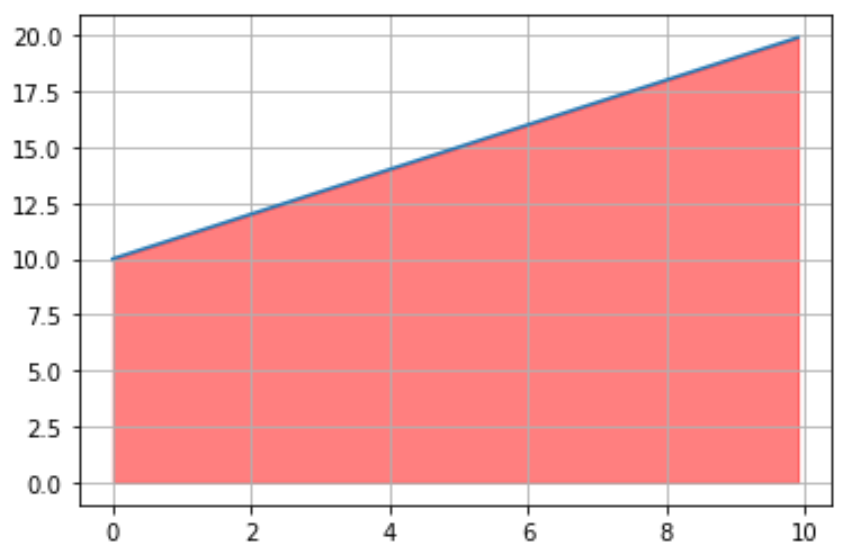
plt.grid()関数を使用してプロットにグリッドを追加し、どの値が入力されているかをより簡単に確認することもできることに注意してください。
 import matplotlib. pyplot as plt
import numpy as np

#define x and y values
x = np. arange (0,10,0.1)
y = np. arange (10,20,0.1)

#create plot of values
plt. plot (x,y)

#fill in area between the two lines
plt. fill_between (x, y, color=' red ', alpha= .5 )

#add gridlines
plt. grid ()
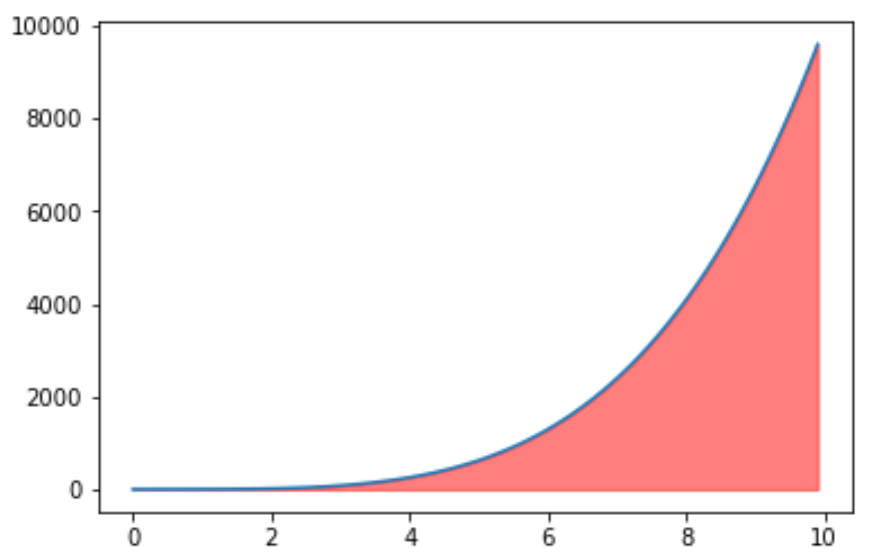
例 2: 曲線の下の領域を塗りつぶす
次のコードは、曲線の下の領域を塗りつぶす方法を示しています。
 import matplotlib. pyplot as plt
import numpy as np

#define x and y values
x = np. arange (0,10,0.1)
y = x**4

#create plot of values
plt. plot (x,y)

#fill in area between the two lines
plt. fill_between (x, y, color=' red ', alpha= .5 )
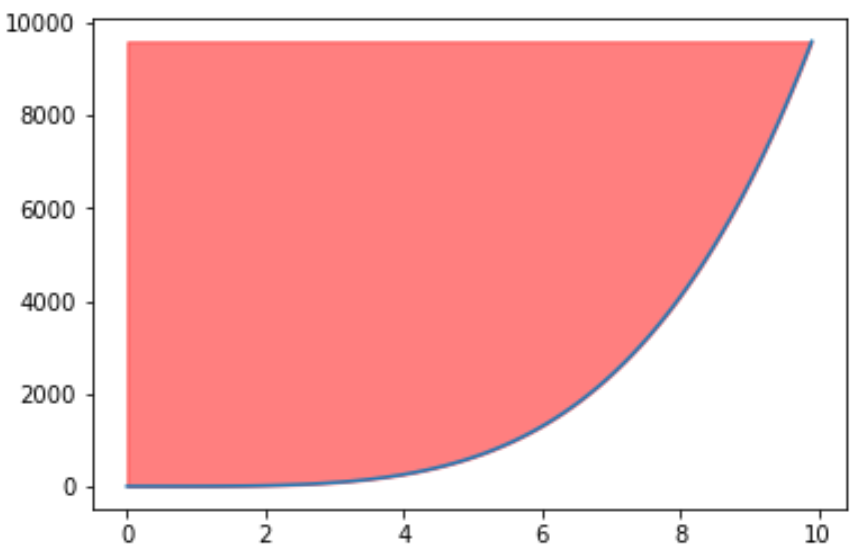
例 3: 曲線の上の領域を塗りつぶす
次のコードは、曲線の上の領域を塗りつぶす方法を示しています。
 import matplotlib. pyplot as plt
import numpy as np

#define x and y values
x = np. arange (0,10,0.1)
y = x**4

#create plot of values
plt. plot (x,y)

#fill in area between the two lines
plt. fill_between (x, y, np. max (y), color=' red ', alpha= .5 )
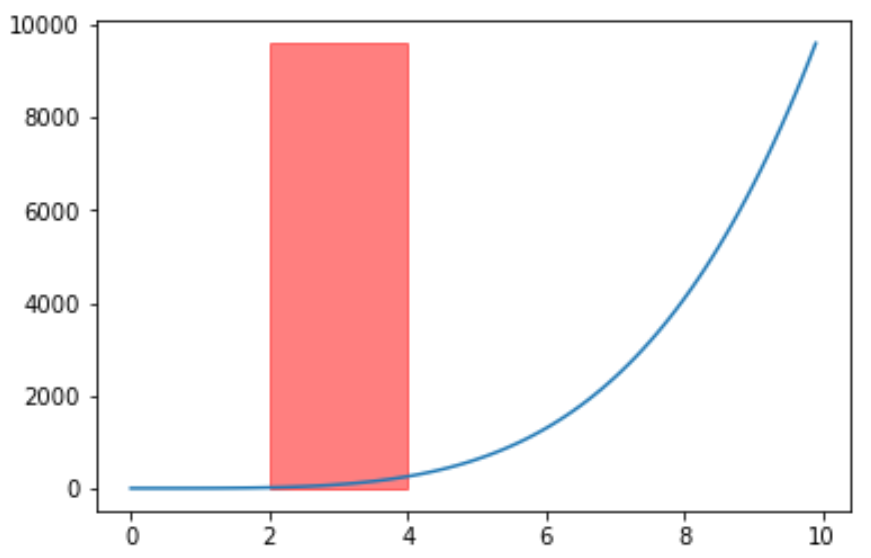
例 4: 2 本の垂直線の間の領域を塗りつぶします。
次のコードは、 fill_betweenx()関数を使用して 2 つの垂直線の間の領域を塗りつぶす方法を示しています。
 import matplotlib. pyplot as plt
import numpy as np

#define x and y values
x = np. arange (0,10,0.1)
y = np. arange (10,20,0.1)

#create plot of values
plt. plot (x,y)

#fill in area between the two lines
plt. fill_betweenx (y, 2, 4, color=' red ', alpha= .5 )
著者について
ベンジャミン・アンダーソン博士
私はベンジャミンです。退職した統計教授から、専任の Statorials 教育者になりました。 統計分野における豊富な経験と専門知識を活かして、私は Statorials を通じて学生に力を与えるために自分の知識を共有することに尽力しています。もっと知る