Matplotlib プロットにテキストを追加する方法 (例付き)
次の構文を使用するmatplotlib.pyplot.text()関数を使用すると、Matplotlib プロットにテキストを簡単に追加できます。
matplotlib.pyplot.text(x, y, s, fontdict=None)
金:
- x:テキストの x 座標
- y:テキストの y 座標
- s:テキスト文字列
- fontdict:デフォルトのテキストプロパティをオーバーライドする辞書
このチュートリアルでは、この機能の実際の使用例をいくつか示します。
例 1: Matplotlib プロットに固有のテキストを追加する
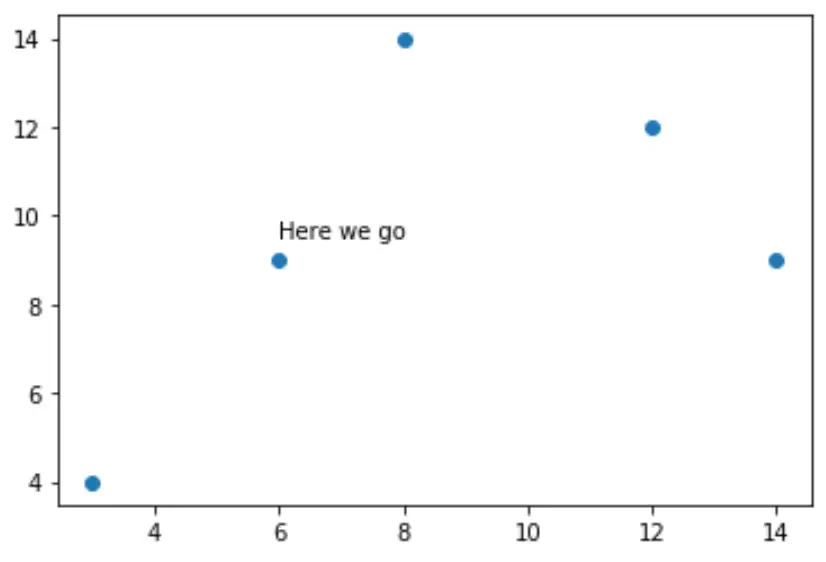
次のコードは、散布図を作成し、プロットに 1 つのテキストを追加する方法を示しています。
 import matplotlib. pyplot as plt

#createdata
x = [3, 6, 8, 12, 14]
y = [4, 9, 14, 12, 9]

#create scatterplot
plt. scatter (x,y)

#add text at (x, y) coordinates = (6, 9.5)
plt. text (6, 9.5, ' Here we go ')

例 2: Matplotlib プロットに複数のテキストを追加する
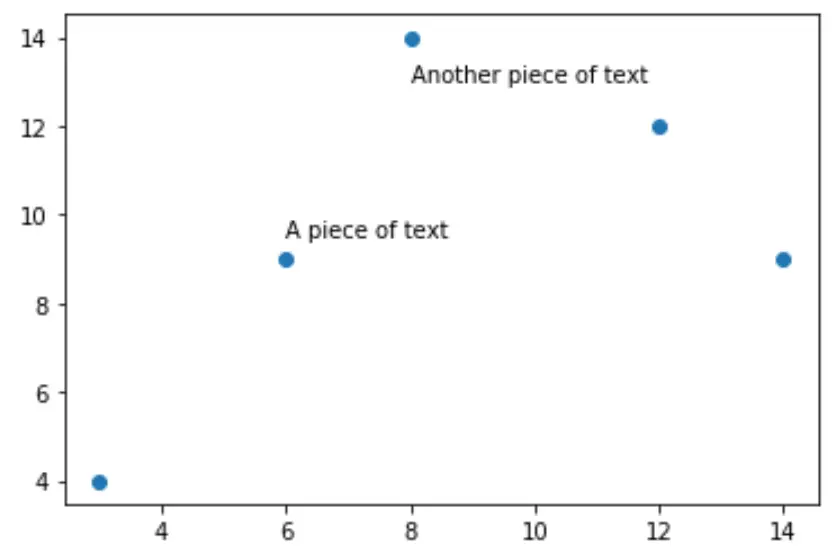
次のコードは、散布図を作成し、プロットに複数のテキストを追加する方法を示しています。
 import matplotlib. pyplot as plt

#create data
x = [3, 6, 8, 12, 14]
y = [4, 9, 14, 12, 9]

#create scatterplot
plt. scatter (x,y)

#add text at (x, y) coordinates = (6, 9.5)
plt. text (6, 9.5, ' A piece of text ')

#add another piece of text
plt. text (8, 13, ' Another piece of text ')

例 3: テキストのプロパティを編集する
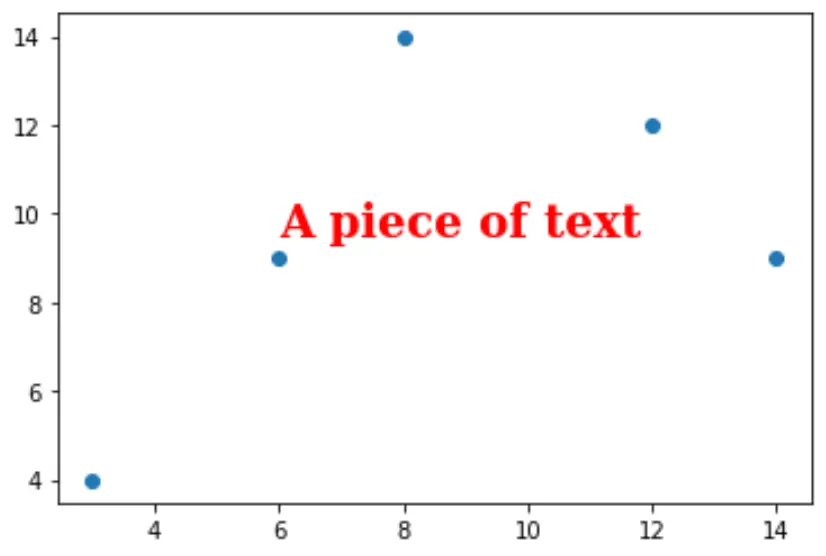
テキストのプロパティを変更するには、フォントのプロパティを指定する辞書を作成します。
次のコードは、これを行う方法を示しています。
 import matplotlib. pyplot as plt

#createdata
x = [3, 6, 8, 12, 14]
y = [4, 9, 14, 12, 9]

#create scatterplot
plt. scatter (x,y)

font = {' family ': ' serif ',
        ' color ': ' red ',
        ' weight ': ' bold ',
        ' size ': 20
        }

#add text with custom font
plt. text (6, 9.5, ' A piece of text ', fontdict=font)

例 4: テキストの周囲にフレームを追加する
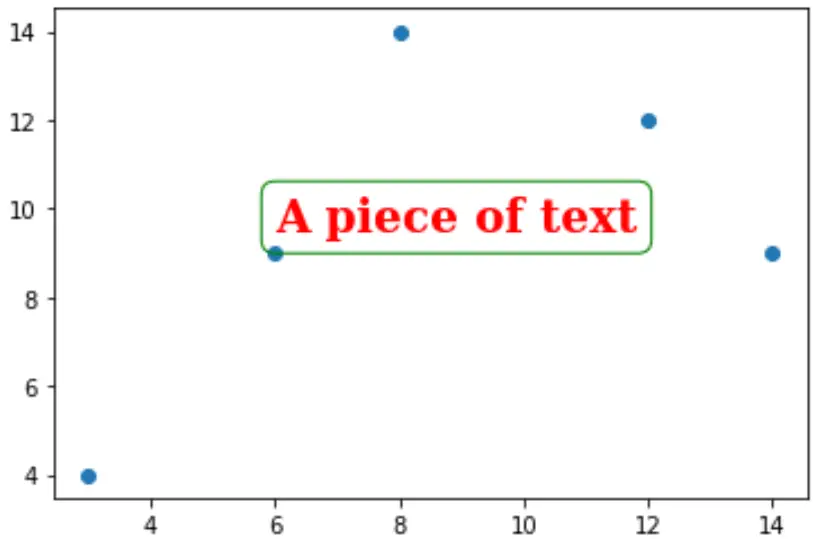
次のコードは、テキストの周囲にフレームを追加する方法を示しています。
 import matplotlib. pyplot as plt

#createdata
x = [3, 6, 8, 12, 14]
y = [4, 9, 14, 12, 9]

#create scatterplot
plt. scatter (x,y)

font = {' family ': ' serif ',
        ' color ': ' red ',
        ' weight ': ' bold ',
        ' size ': 20
        }

box = {' facecolor ': ' none ',
       ' edgecolor ': ' green ',
       ' boxstyle ': ' round '
      }

#add text with custom font
plt. text (6, 9.5, ' A piece of text ', fontdict=font, bbox=box)
