Matplotlib プロットにグリッド線を表示する方法
デフォルトでは、Matplotlib はプロット上にグリッド線を表示しません。ただし、 matplotlib.pyplot.grid()関数を使用すると、プロット上のグリッド線を簡単に表示およびカスタマイズできます。
このチュートリアルでは、この機能の実際の使用例を示します。
Matplotlib の基本的な散布図
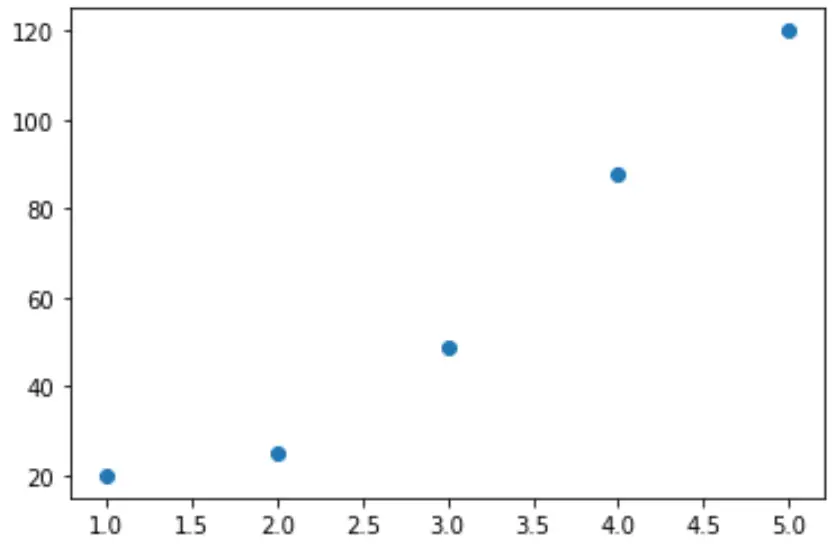
次のコードは、Matplotlib を使用して単純な散布図を作成する方法を示しています。
 import matplotlib.pyplot as plt

#createdata
x = [1, 2, 3, 4, 5]
y = [20, 25, 49, 88, 120]

#create scatterplot of data
plt. scatter (x,y)
plt. show ()
両方の軸にグリッド線を追加する
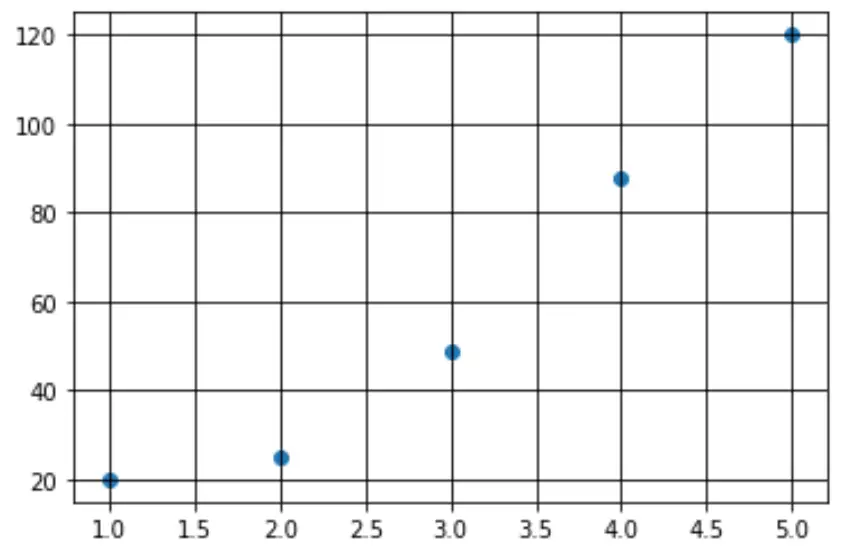
プロットにグリッドを追加するには、単にplt.grid(True)コマンドを使用します。
 import matplotlib.pyplot as plt

#create data
x = [1, 2, 3, 4, 5]
y = [20, 25, 49, 88, 120]

#create scatterplot of data with gridlines
plt. scatter (x,y)
plt. grid ( True )
plt. show ()
単軸グリッドを追加する
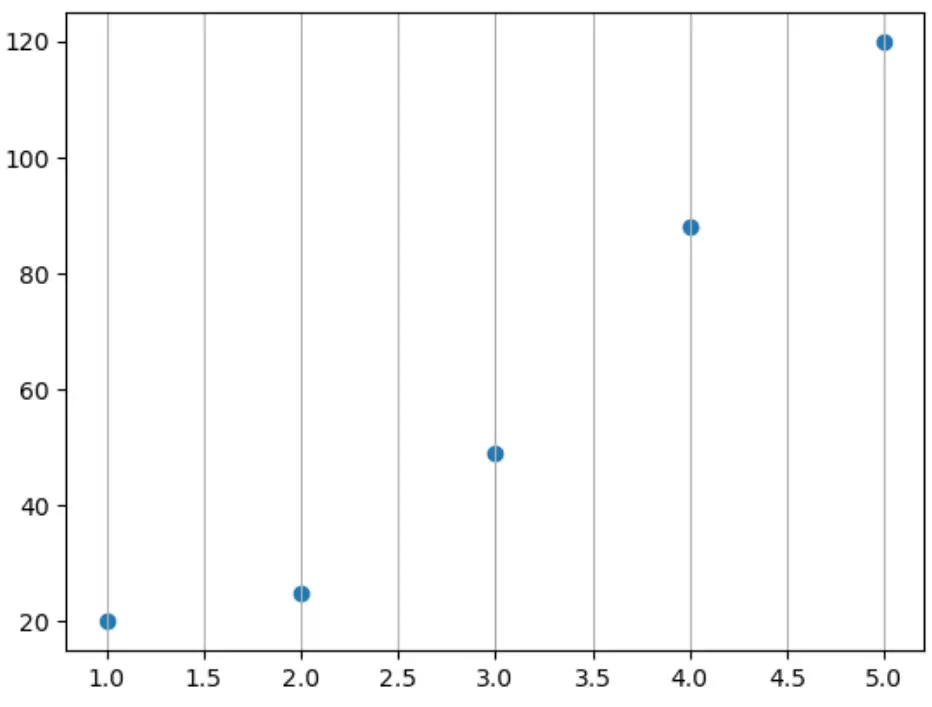
axis引数を使用して、x 軸にグリッド線だけを追加できます。
 import matplotlib.pyplot as plt

#createdata
x = [1, 2, 3, 4, 5]
y = [20, 25, 49, 88, 120]

#create scatterplot of data with gridlines
plt. scatter (x,y)
plt. grid ( axis=' x ' )
plt. show ()
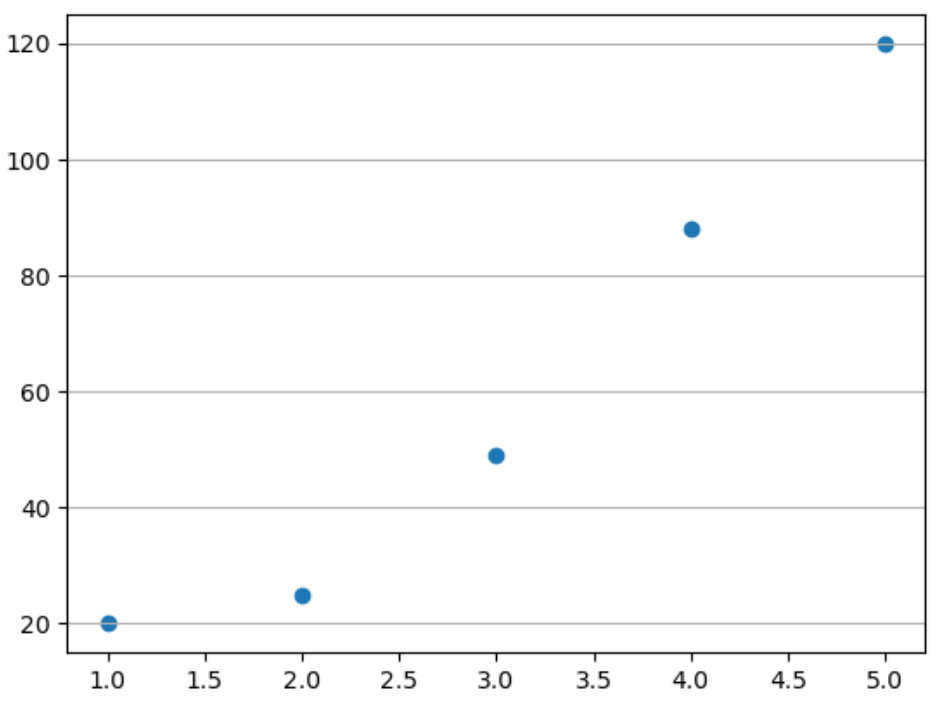
または、y 軸だけを指定します。
 import matplotlib.pyplot as plt

#createdata
x = [1, 2, 3, 4, 5]
y = [20, 25, 49, 88, 120]

#create scatterplot of data with gridlines
plt. scatter (x,y)
plt. grid ( axis=' y ' )
plt. show ()
グリッドをカスタマイズする
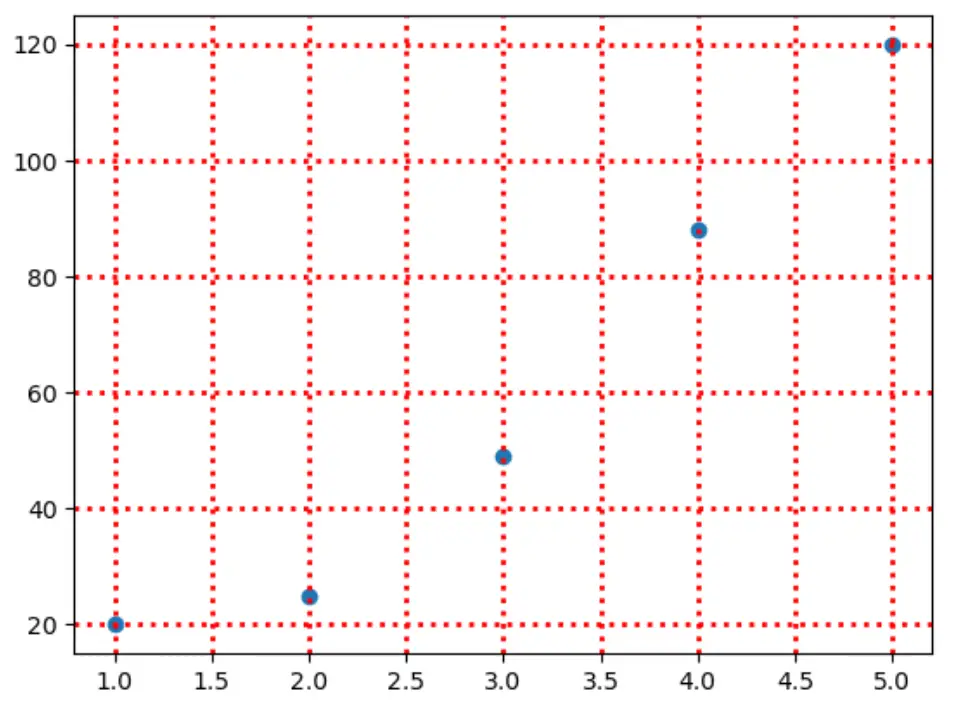
plt.rc()関数を使用してグリッドの外観をカスタマイズすることもできます。
 import matplotlib.pyplot as plt

#create data
x = [1, 2, 3, 4, 5]
y = [20, 25, 49, 88, 120]

#create scatterplot of data with gridlines
plt. rc (' grid ', linestyle=' : ', color=' red ', linewidth= 2 )
plt. scatter (x,y)
plt. grid ( True )
plt. show ()
グリッドラインをカスタマイズする方法の完全なリストは、Matplotlib ドキュメントで見つけることができます。
追加リソース
次のチュートリアルでは、Matplotlib で他の一般的なタスクを実行する方法を説明します。