Matplotlib で軸ラベルの位置を調整する方法
次の基本構文を使用して、Matplotlib で軸ラベルの位置を調整できます。
 #adjust y-axis label position
ax. yaxis . set_label_coords (-.1, .5)

#adjust x-axis label position
ax. xaxis . set_label_coords (.5, -.1)
次の例は、この構文を実際に使用する方法を示しています。
例 1: X 軸上のラベルの位置を調整する
次のコードは、Matplotlib でプロットを作成し、X 軸上のラベルの位置のみを調整する方法を示しています。
 import matplotlib. pyplot as plt

#define data
x = [1, 2, 3, 4, 5, 6]
y = [4, 5, 8, 14, 24, 19]

#create scatterplot
fig, ax = plt. subplots ()
ax. scatter (x,y)

#add axis labels
ax. set_ylabel (' Y-Axis Label ')
ax. set_xlabel (' X-Axis Label ')

#adjust position of x-axis label
ax. xaxis . set_label_coords (.9, -.1)
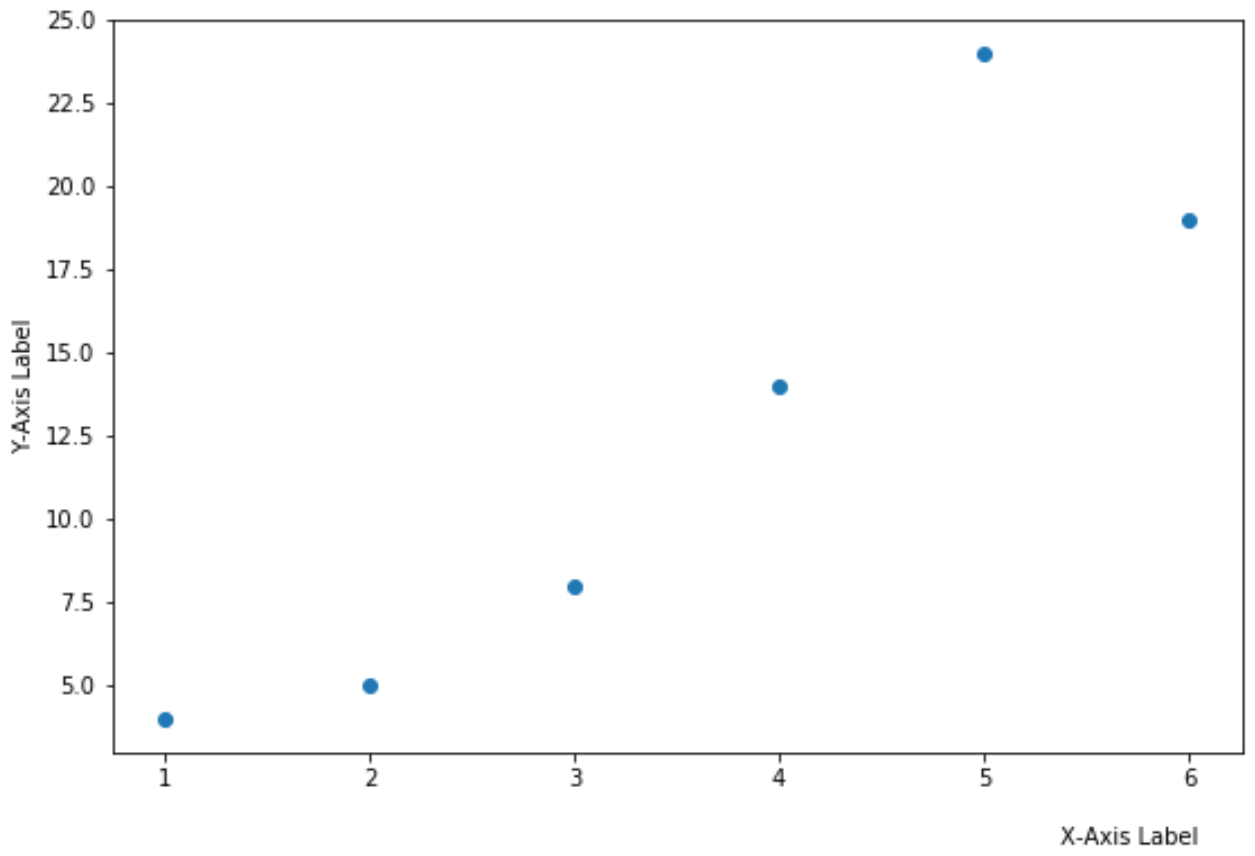
軸座標系は、プロットの左下隅を表すのに(0, 0) 、中心を表すのに(0.5, 0.5) 、右上隅を表すのに(1, 1)を使用することに注意してください。
例 2: Y 軸上のラベルの位置を調整する
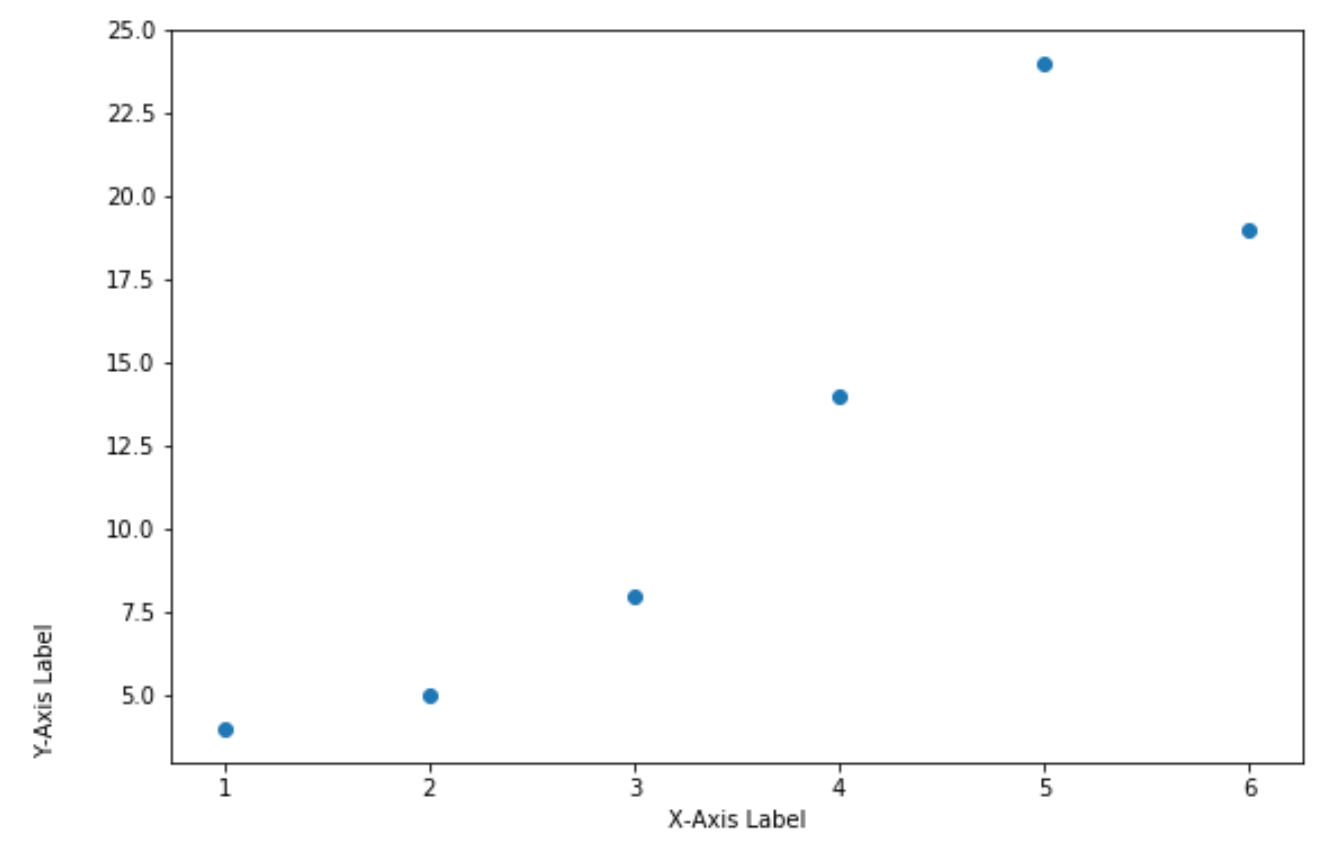
次のコードは、Matplotlib でプロットを作成し、Y 軸ラベルの位置のみを調整する方法を示しています。
 import matplotlib. pyplot as plt

#define data
x = [1, 2, 3, 4, 5, 6]
y = [4, 5, 8, 14, 24, 19]

#create scatterplot
fig, ax = plt. subplots ()
ax. scatter (x,y)

#add axis labels
ax. set_ylabel (' Y-Axis Label ')
ax. set_xlabel (' X-Axis Label ')

#adjust position of x-axis label
ax. yaxis . set_label_coords (-.1, .1)
例 3: 両軸のラベル位置を調整する
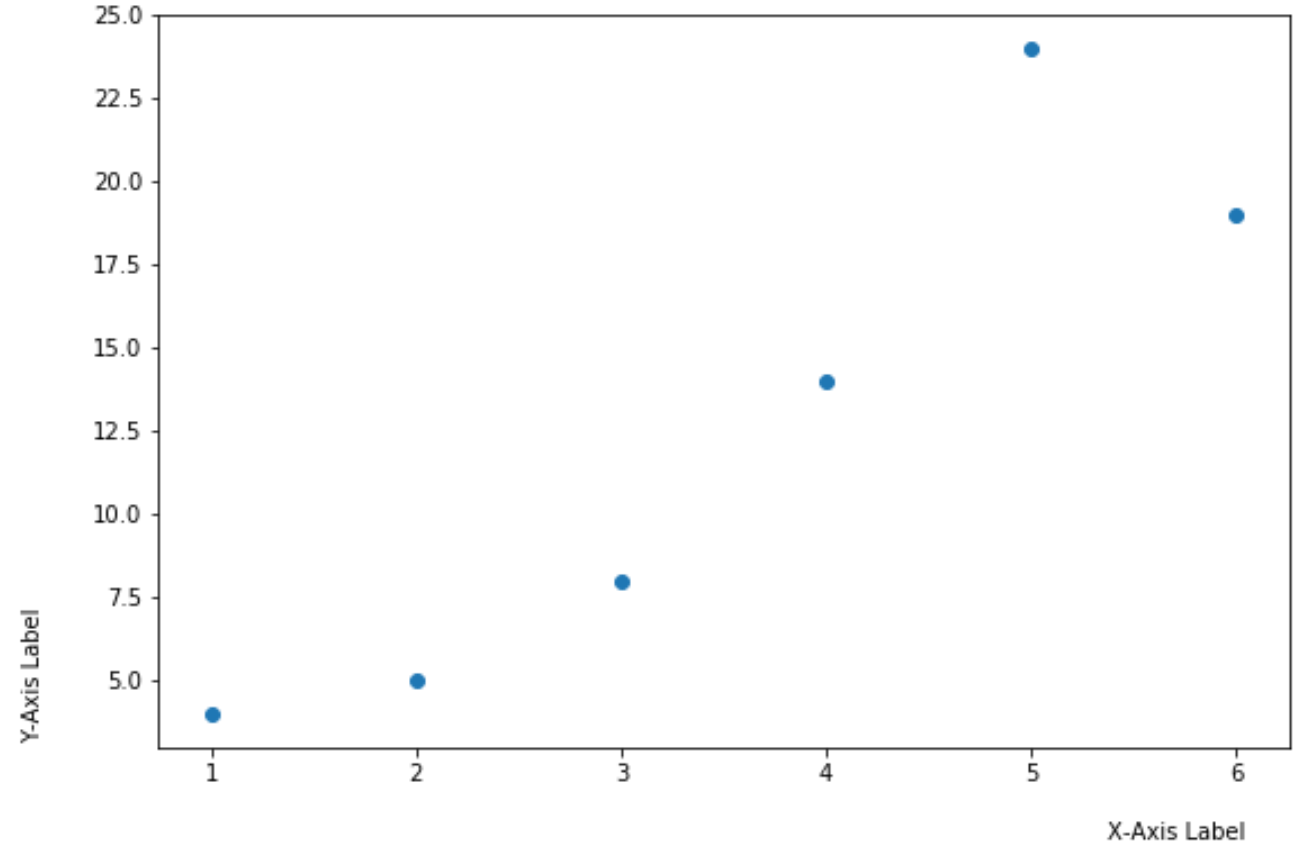
次のコードは、Matplotlib でプロットを作成し、2 つの軸のラベル位置を調整する方法を示しています。
 import matplotlib. pyplot as plt

#define data
x = [1, 2, 3, 4, 5, 6]
y = [4, 5, 8, 14, 24, 19]

#create scatterplot
fig, ax = plt. subplots ()
ax. scatter (x,y)

#add axis labels
ax. set_ylabel (' Y-Axis Label ')
ax. set_xlabel (' X-Axis Label ')

#adjust position of both axis labels
ax. yaxis . set_label_coords (-.1, .1)
ax. xaxis . set_label_coords (.9, -.1)
追加リソース
次のチュートリアルでは、Matplotlib で他の一般的な関数を実行する方法を説明します。
Matplotlib で軸を非表示にする方法
Matplotlib でチェックマーク ラベルを回転する方法
Matplotlib でティック数を変更する方法
著者について
ベンジャミン・アンダーソン博士
私はベンジャミンです。退職した統計教授から、専任の Statorials 教育者になりました。 統計分野における豊富な経験と専門知識を活かして、私は Statorials を通じて学生に力を与えるために自分の知識を共有することに尽力しています。もっと知る