Matplotlib で軸を反転する方法 (例付き)
次の基本構文を使用して、Matplotlib で x 軸と y 軸を反転できます。
 plt. gca (). invert_xaxis ()
plt. gca (). invert_yaxis ()
次の例は、この構文を実際に使用する方法を示しています。
例: Matplotlib での軸の反転
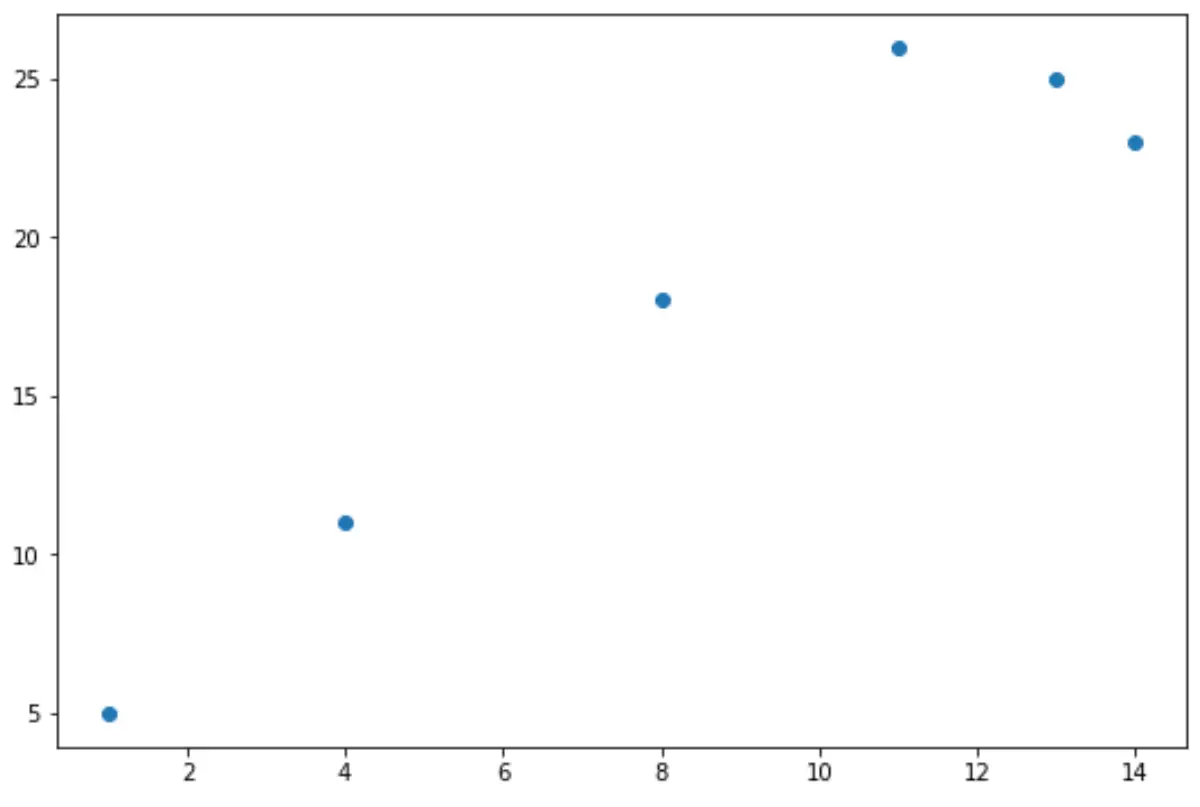
次のコードは、Matplotlib で基本的な散布図を作成する方法を示しています。
 import matplotlib. pyplot as plt

#define x and y
x = [1, 4, 8, 11, 13, 14]
y = [5, 11, 18, 26, 25, 23]

#create scatterplot of x and y
plt. scatter (x,y)
次のコードを使用して、 y 軸を反転できます。
 import matplotlib. pyplot as plt

#define x and y
x = [1, 4, 8, 11, 13, 14]
y = [5, 11, 18, 26, 25, 23]

#create scatterplot of x and y
plt. scatter (x,y)

#reverse y-axis
plt. gca (). invert_yaxis ()
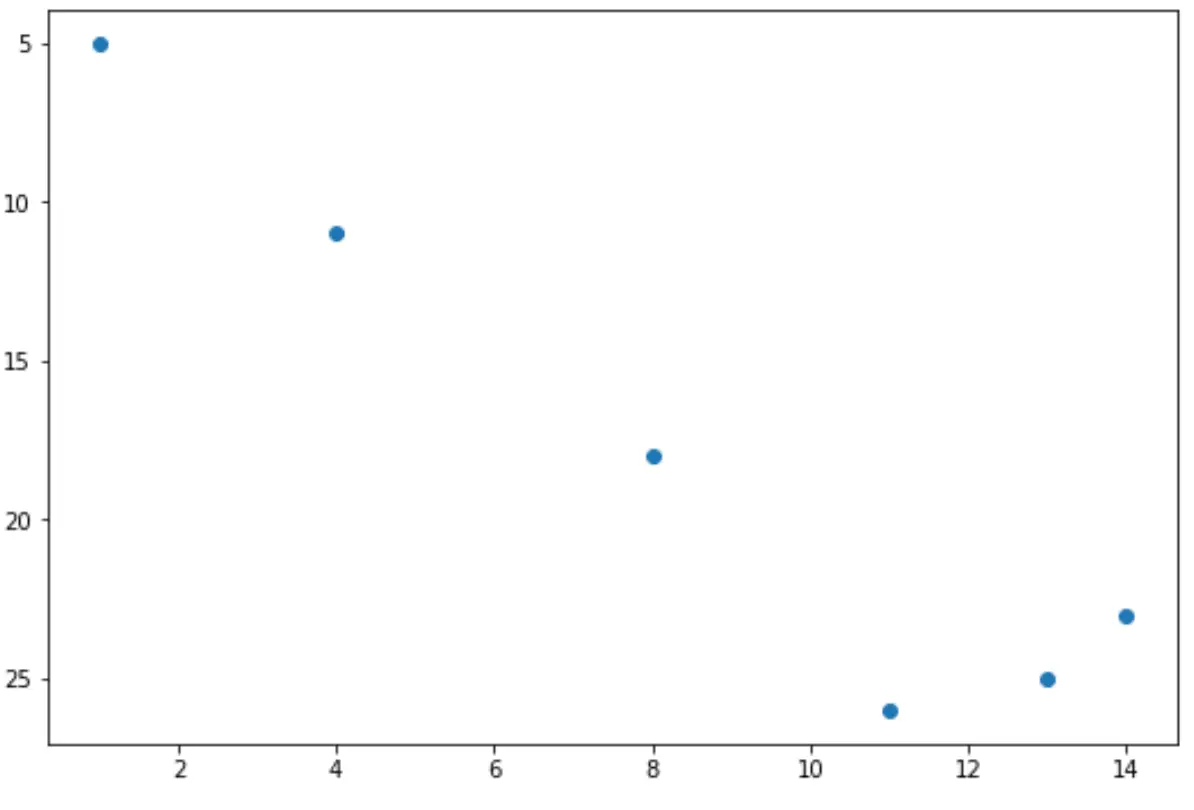
Y 軸が 5 から 25 ではなく 25 から 5 になることに注意してください。
あるいは、次のコードを使用してx 軸を反転することもできます。
 import matplotlib. pyplot as plt

#define x and y
x = [1, 4, 8, 11, 13, 14]
y = [5, 11, 18, 26, 25, 23]

#create scatterplot of x and y
plt. scatter (x,y)

#reverse x-axis
plt. gca (). invert_xaxis ()
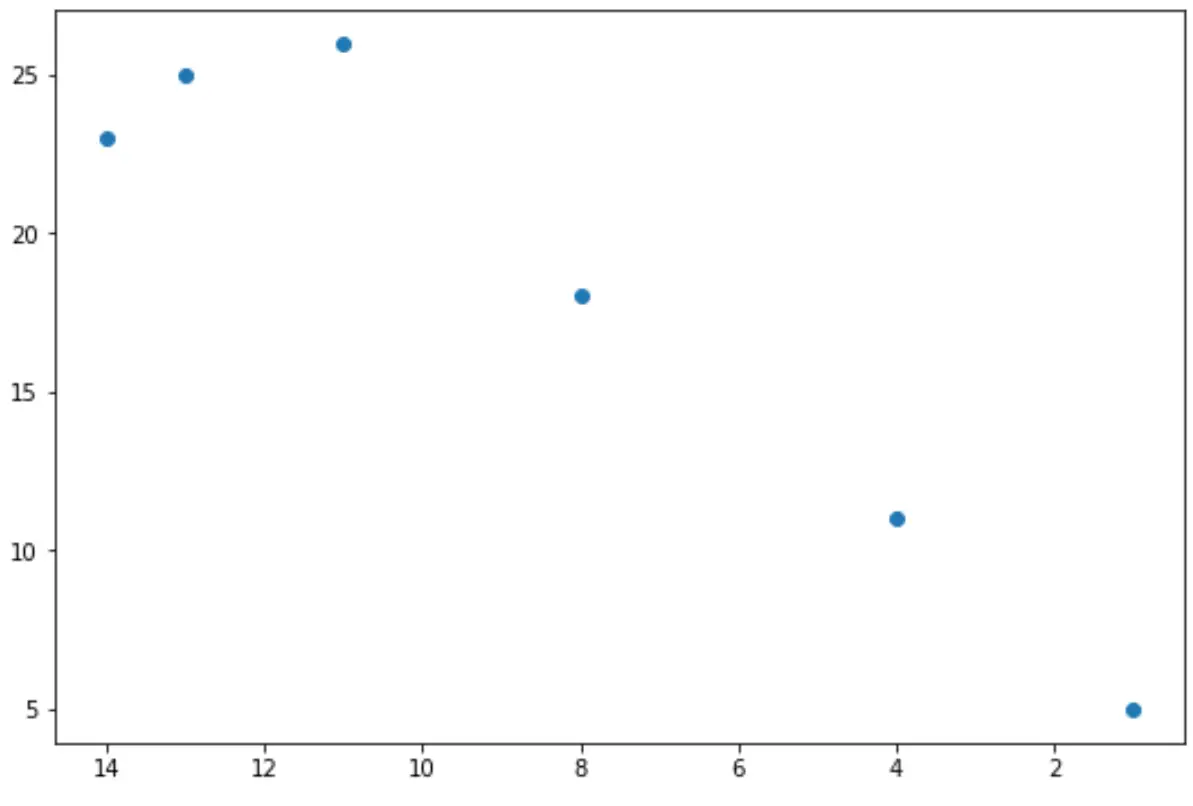
X 軸が 0 から 14 ではなく 14 から 0 になることに注意してください。
最後に、次のコードを使用して2 つの軸を反転できます。
 import matplotlib. pyplot as plt

#define x and y
x = [1, 4, 8, 11, 13, 14]
y = [5, 11, 18, 26, 25, 23]

#create scatterplot of x and y
plt. scatter (x,y)

#reverse both axes
plt. gca (). invert_xaxis ()
plt. gca (). invert_yaxis ()
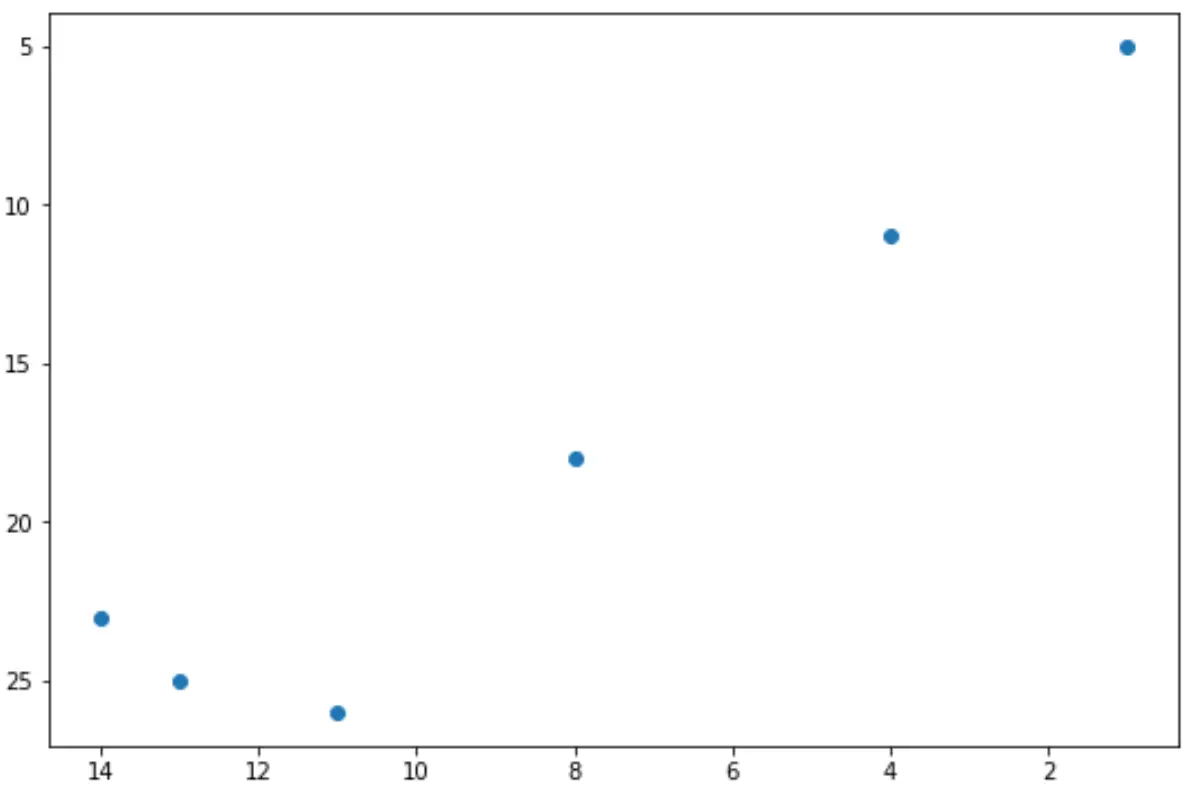
2つの軸の値が反転していることに注意してください。
追加リソース
次のチュートリアルでは、Matplotlib で他の一般的な操作を実行する方法を説明します。
Matplotlib で軸範囲を設定する方法
Matplotlib で軸の目盛りを設定する方法
Matplotlib で軸ラベルの位置を調整する方法
著者について
ベンジャミン・アンダーソン博士
私はベンジャミンです。退職した統計教授から、専任の Statorials 教育者になりました。 統計分野における豊富な経験と専門知識を活かして、私は Statorials を通じて学生に力を与えるために自分の知識を共有することに尽力しています。もっと知る