Matplotlib でティック数を変更する方法
次の構文を使用して、Matplotlib の各軸のティック数を変更できます。
 #specify number of ticks on x-axis
plt. locator_params (axis=' x ', nbins= 4 )

#specify number of ticks on y-axis
plt. locator_params (axis=' y ', nbins= 2 )
nbins引数は、各軸に表示するティック数を指定します。
次の例は、この構文を実際に使用する方法を示しています。
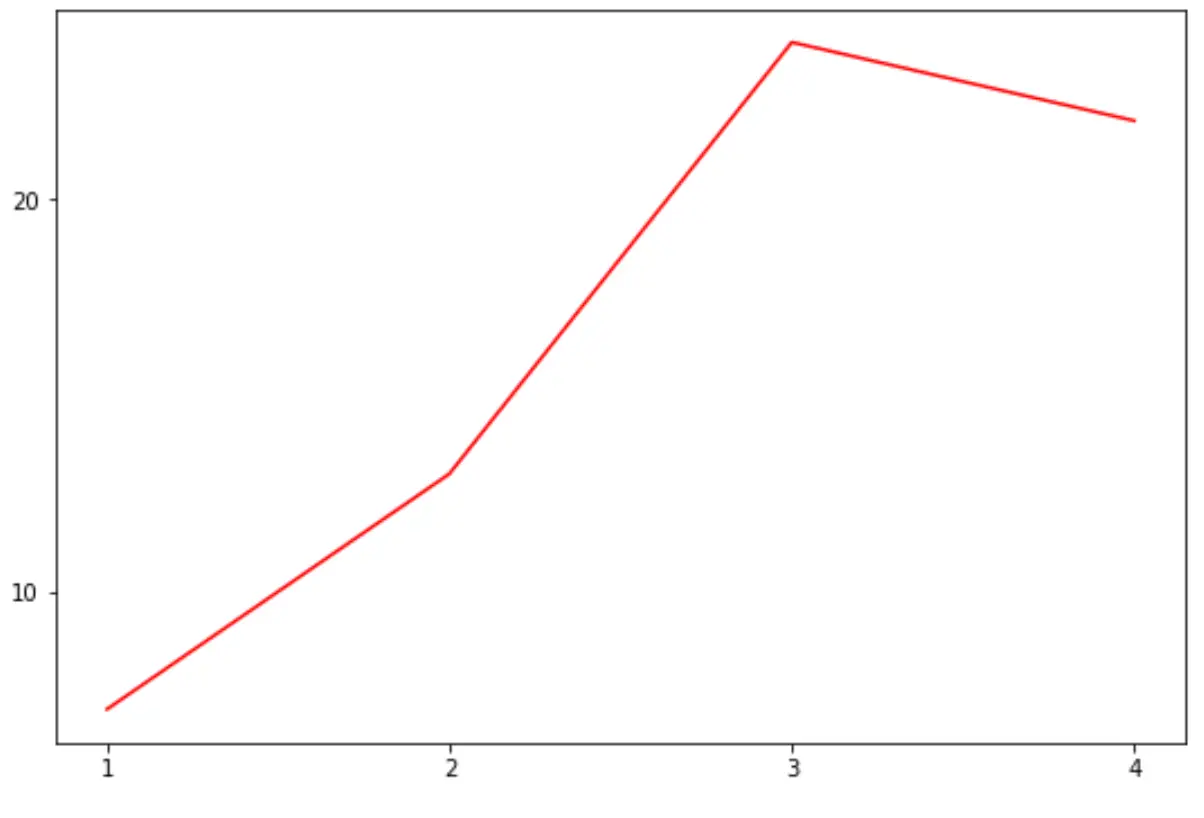
例 1: 両方の軸のティック数を指定する
次のコードは、プロットの軸上の両方の目盛数を指定する方法を示しています。
 import matplotlib. pyplot as plt

#define data
x = [1, 2, 3, 4]
y = [7, 13, 24, 22]

#createplot
plt. plot (x,y,color=' red ')

#specify number of ticks on axes
plt. locator_params (axis=' x ', nbins= 4 )
plt. locator_params (axis=' y ', nbins= 2 )
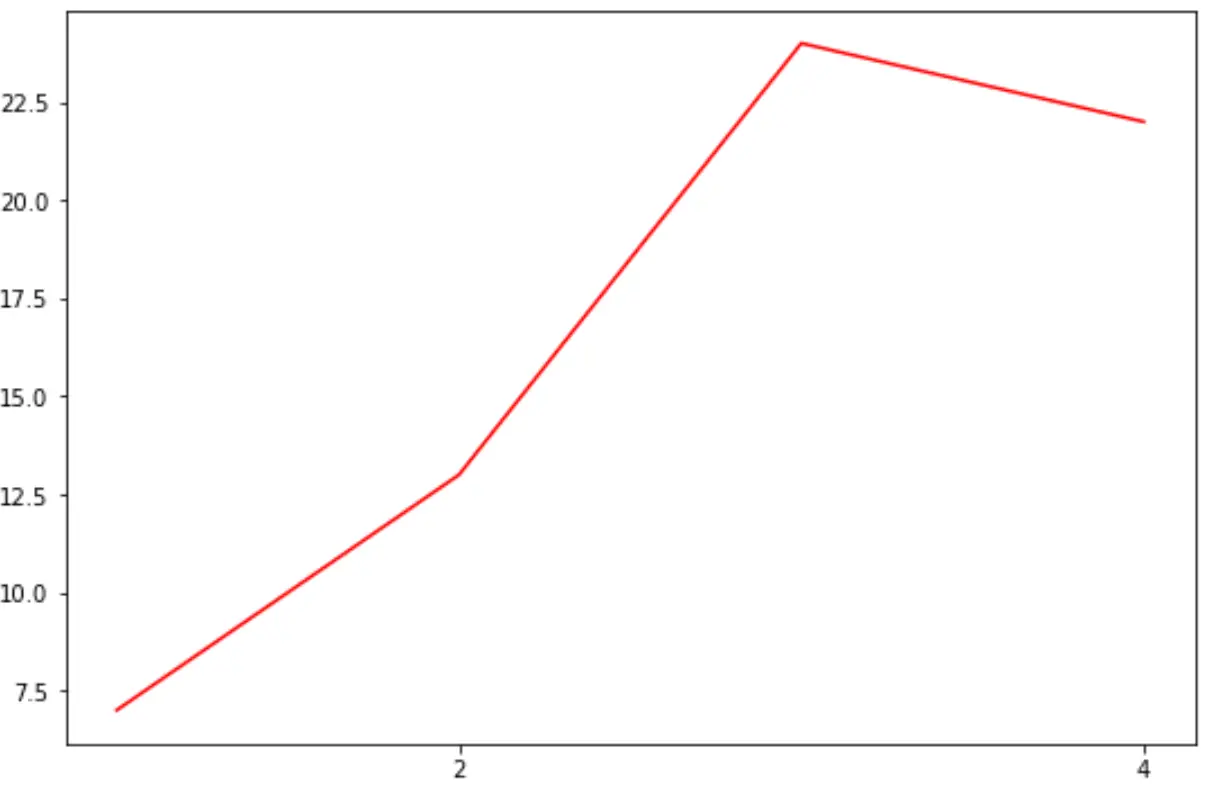
例 2: X 軸の目盛りの数のみを指定する
次のコードは、X 軸のみのティック数を指定する方法を示しています。
 import matplotlib. pyplot as plt

#define data
x = [1, 2, 3, 4]
y = [7, 13, 24, 22]

#createplot
plt. plot (x,y,color=' red ')

#specify number of ticks on x-axis
plt. locator_params (axis=' x ', nbins= 2 )
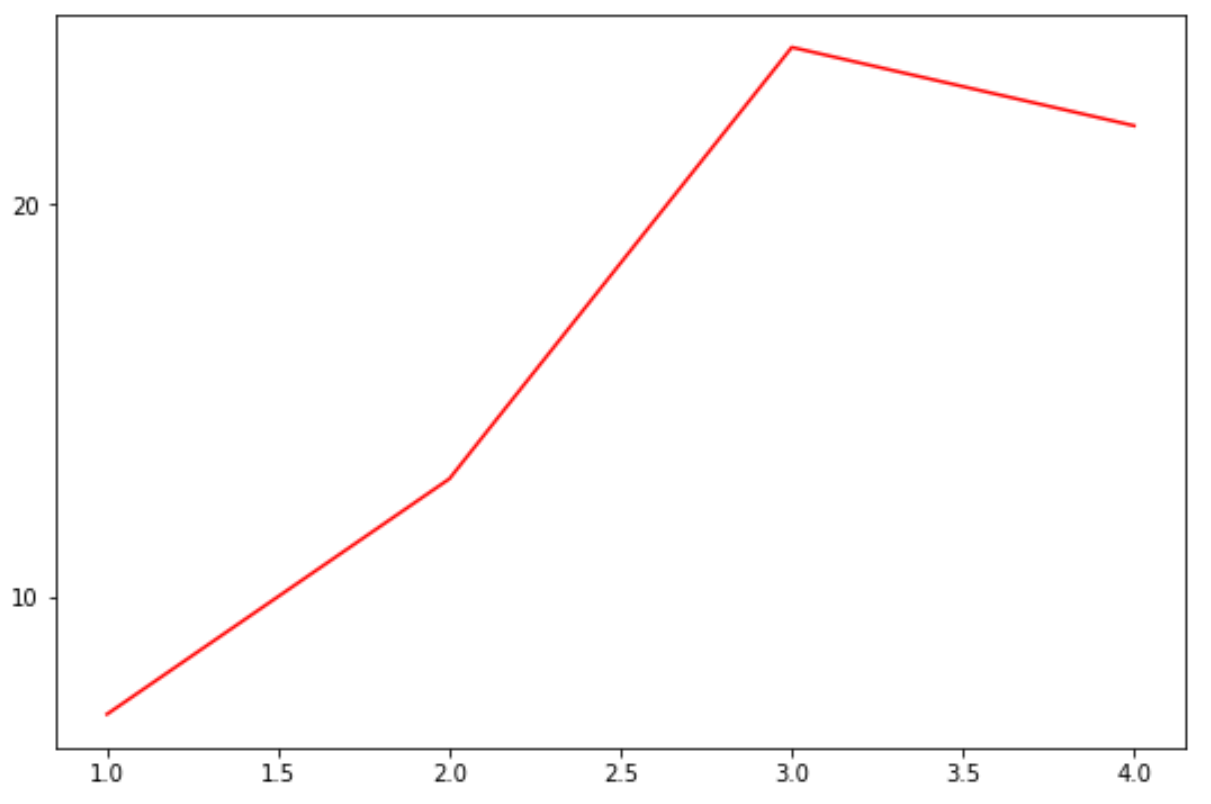
例 3: Y 軸上の目盛りの数のみを指定する
次のコードは、Y 軸のみのティック数を指定する方法を示しています。
 import matplotlib. pyplot as plt

#define data
x = [1, 2, 3, 4]
y = [7, 13, 24, 22]

#createplot
plt. plot (x,y,color=' red ')

#specify number of ticks on y-axis
plt. locator_params (axis=' y ', nbins= 2 )
追加リソース
Matplotlib プロットから目盛りを削除する方法
Matplotlib でチェックマーク ラベルのフォント サイズを設定する方法
MatplotlibでX軸の値を設定する方法
Matplotlib で軸範囲を設定する方法
著者について
ベンジャミン・アンダーソン博士
私はベンジャミンです。退職した統計教授から、専任の Statorials 教育者になりました。 統計分野における豊富な経験と専門知識を活かして、私は Statorials を通じて学生に力を与えるために自分の知識を共有することに尽力しています。もっと知る