Matplotlib で水平グリッドのみをプロットする方法
次の基本構文を使用して、Matplotlib で水平グリッドのみをプロットできます。
ax. grid (axis=' y ')
次の例は、この構文を実際に使用する方法を示しています。
例: Matplotlib で水平グリッドのみをプロットする
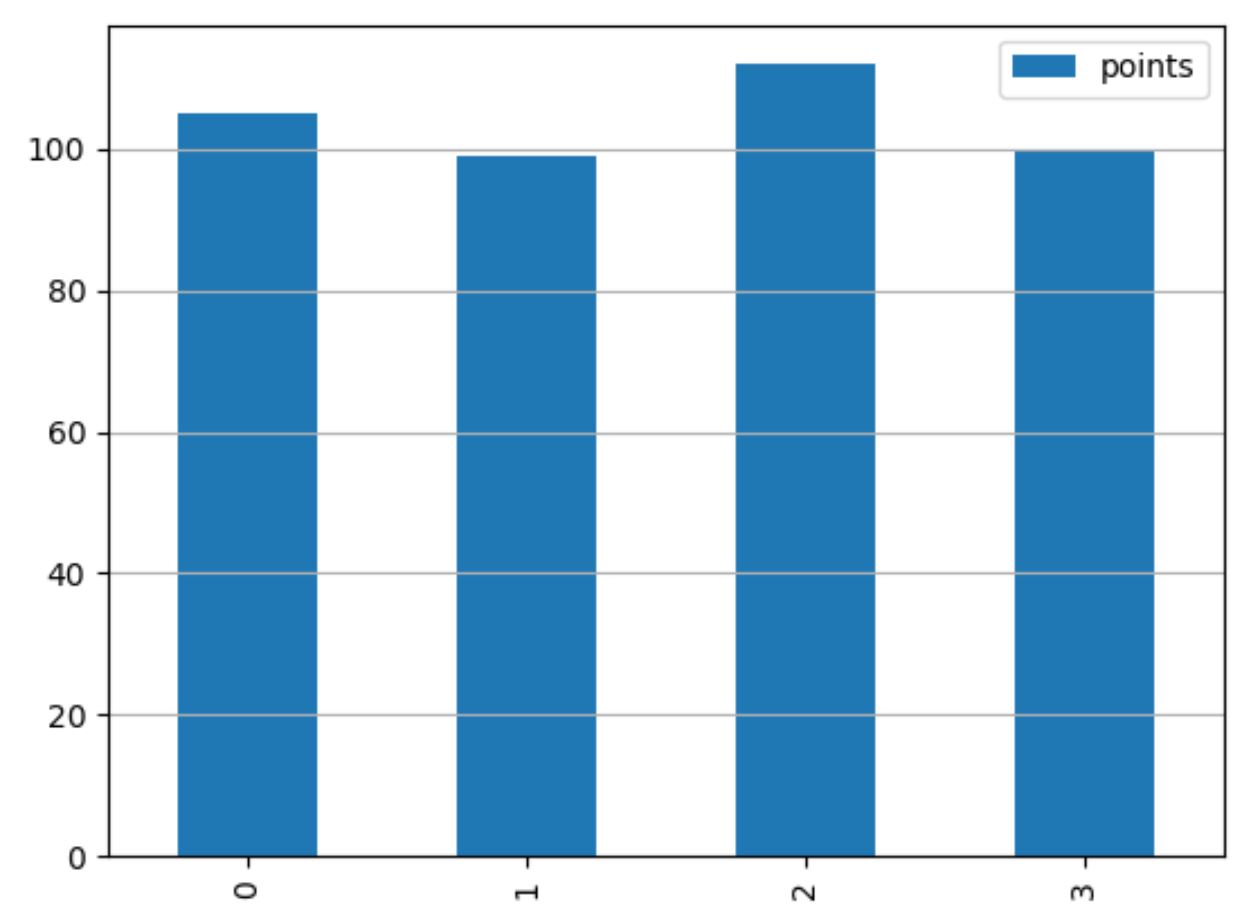
次のコードは、プロットに水平グリッドのみが表示される棒グラフを Matplotlib で作成する方法を示しています。
 import pandas as pd
import matplotlib. pyplot as plt

#createDataFrame
df = pd. DataFrame ({' team ':['Mavs', 'Nets', 'Spurs', 'Warriors'],
                   ' points ':[105, 99, 112, 100]})

#defineplot
fig, ax = plt. subplots ()

#create bar plot
df. plot (kind=' bar ', ax=ax)

#add horizontal gridlines
ax. grid (axis=' y ')

#displayplot
plt. show ()
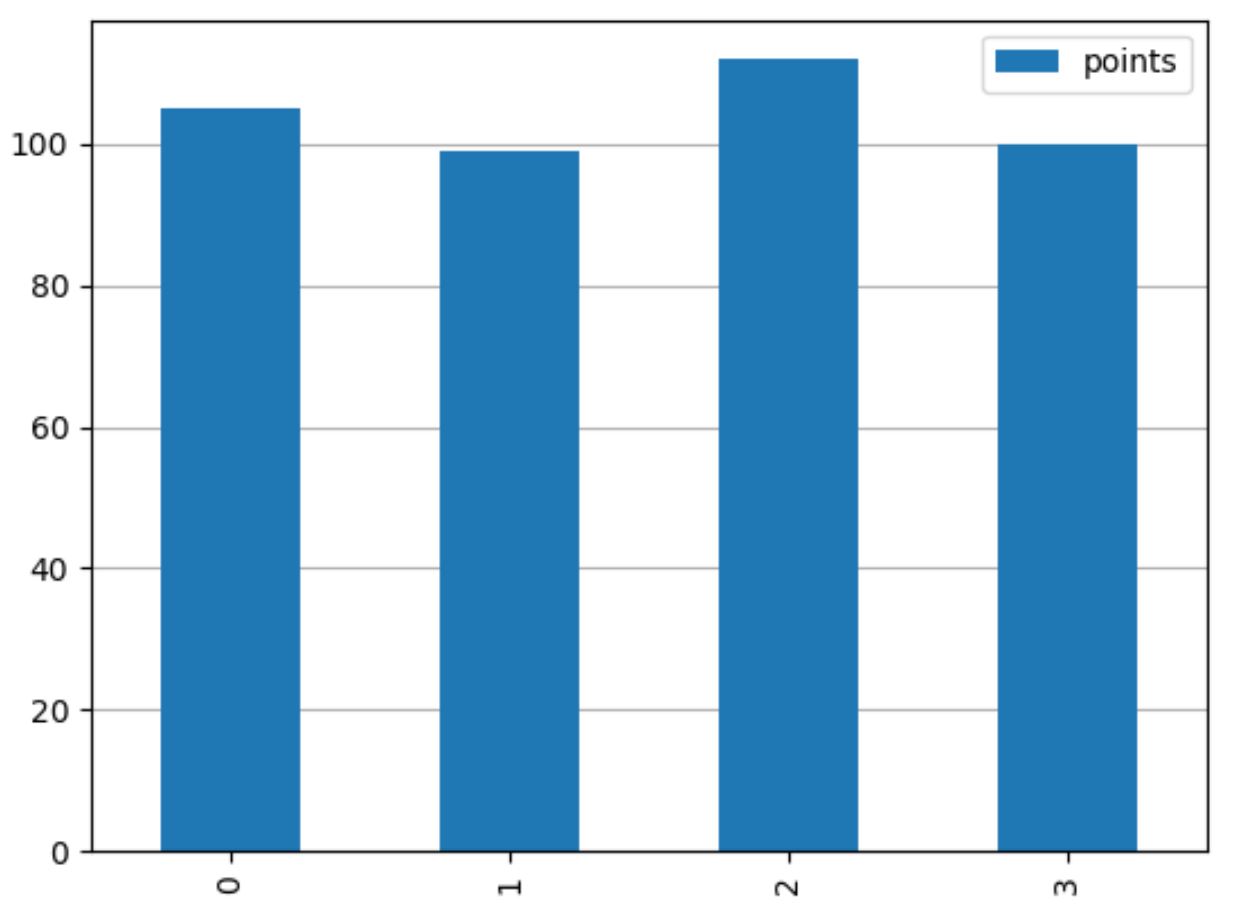
ax.set_axisbelow(True)を自由に使用して、プロットのバーの背後に水平グリッド線を表示します。
 import pandas as pd
import matplotlib. pyplot as plt

#createDataFrame
df = pd. DataFrame ({' team ':['Mavs', 'Nets', 'Spurs', 'Warriors'],
                   ' points ':[105, 99, 112, 100]})

#defineplot
fig, ax = plt. subplots ()

#create bar plot
df. plot (kind=' bar ', ax=ax)

#add horizontal gridlines behind bars in the plot
ax. set_axisbelow ( True )
ax. grid (axis=' y ')

#displayplot
plt. show ()
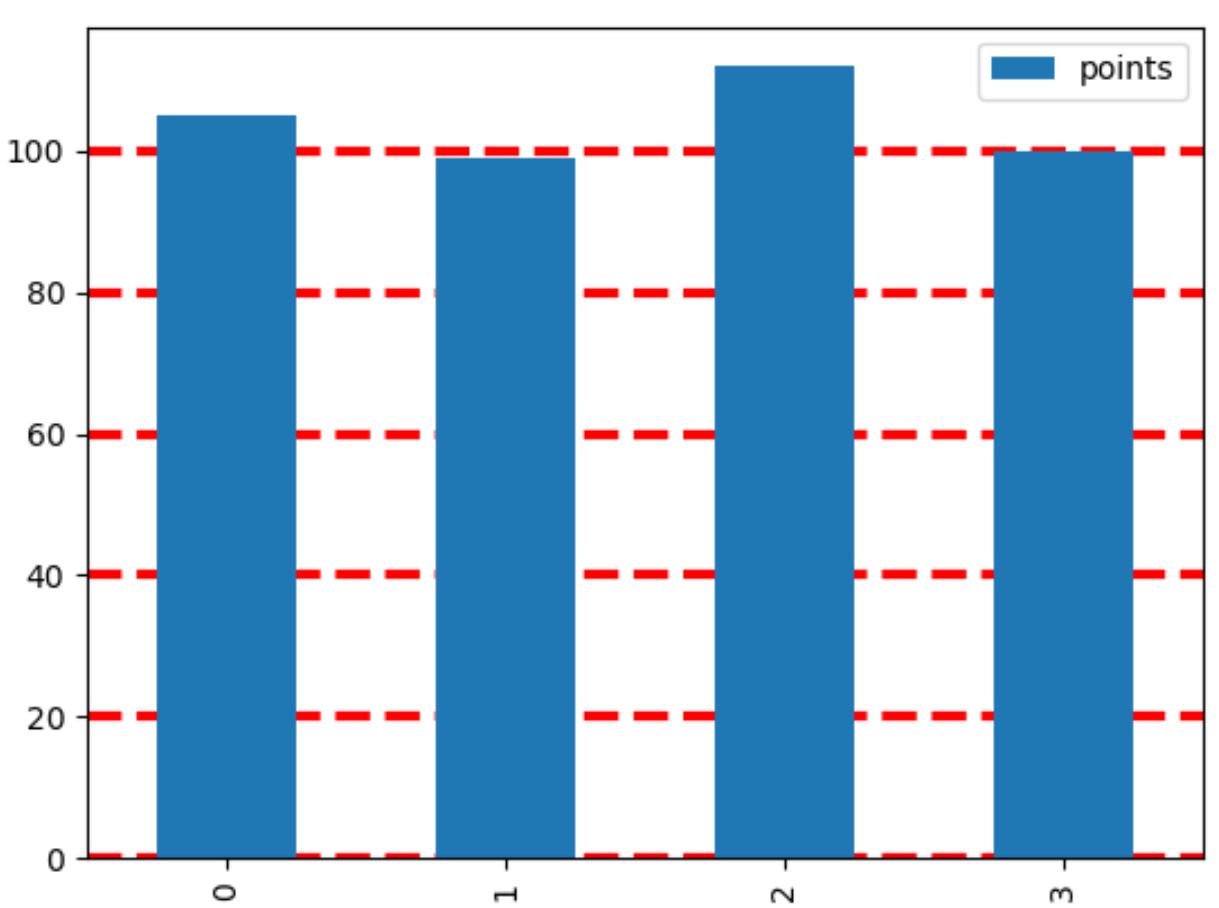
また、 Grid()関数でcolor 、 linestyle 、 linewidth引数を自由に使用して、グリッドの外観をカスタマイズできます。
 import pandas as pd
import matplotlib. pyplot as plt

#createDataFrame
df = pd. DataFrame ({' team ':['Mavs', 'Nets', 'Spurs', 'Warriors'],
                   ' points ':[105, 99, 112, 100]})

#defineplot
fig, ax = plt. subplots ()

#create bar plot
df. plot (kind=' bar ', ax=ax)

#add horizontal gridlines with custom appearance
ax. set_axisbelow ( True )
ax. grid (axis=' y ', color=' red ', linestyle=' dashed ', linewidth= 3 )

#displayplot
plt. show ()
グリッドラインをカスタマイズする方法の完全なリストは、Matplotlib ドキュメントで見つけることができます。
追加リソース
次のチュートリアルでは、Matplotlib で他の一般的なタスクを実行する方法を説明します。
Matplotlib プロットから目盛を削除する方法
Matplotlib プロットのフォント サイズを変更する方法
Matplotlib でプロットに平均線を追加する方法
著者について
ベンジャミン・アンダーソン博士
私はベンジャミンです。退職した統計教授から、専任の Statorials 教育者になりました。 統計分野における豊富な経験と専門知識を活かして、私は Statorials を通じて学生に力を与えるために自分の知識を共有することに尽力しています。もっと知る