Python で一変量分析を実行する方法: 例付き
一変量分析という用語は、1 つの変数の分析を指します。接頭辞「uni」は「1」を意味するので、これを覚えておくとよいでしょう。
変数に対して一変量分析を実行するには、次の 3 つの一般的な方法があります。
1. 要約統計– 値の中心と分布を測定します。
2. 頻度表– 異なる値がどのくらいの頻度で現れるかを説明します。
3. チャート– 値の分布を視覚化するために使用されます。
このチュートリアルでは、次の pandas DataFrame を使用して一変量分析を実行する方法の例を示します。
 import pandas as pd

#createDataFrame
df = pd. DataFrame ({' points ': [1, 1, 2, 3.5, 4, 4, 4, 5, 5, 6.5, 7, 7.4, 8, 13, 14.2],
                   ' assists ': [5, 7, 7, 9, 12, 9, 9, 4, 6, 8, 8, 9, 3, 2, 6],
                   ' rebounds ': [11, 8, 10, 6, 6, 5, 9, 12, 6, 6, 7, 8, 7, 9, 15]})

#view first five rows of DataFrame
df. head ()

	points assists rebounds
0 1.0 5 11
1 1.0 7 8
2 2.0 7 10
3 3.5 9 6
4 4.0 12 6
1. 要約統計量を計算する
次の構文を使用して、DataFrame の「points」変数のさまざまな要約統計量を計算できます。
 #calculate mean of 'points'
df[' points ']. mean ()

5.706666666666667

#calculate median of 'points'
df[' points ']. median ()

5.0

#calculate standard deviation of 'points'
df[' points ']. std ()

3.858287308169384
2.度数表を作成する
次の構文を使用して、変数「points」の度数表を作成できます。
 #create frequency table for 'points'
df[' points ']. value_counts ()

4.0 3
1.0 2
5.0 2
2.0 1
3.5 1
6.5 1
7.0 1
7.4 1
8.0 1
13.0 1
14.2 1
Name: points, dtype: int64
これは次のことを示しています。
- 値4 が3 回出現します
- 値1が 2 回表示されます
- 値5 が2 回表示されます
- 値2 は1 回出現します
等々。
3. グラフの作成
次の構文を使用して、「points」変数の 箱ひげ図を作成できます。
 import matplotlib. pyplot as plt

df. boxplot (column=[' points '], grid= False , color=' black ')
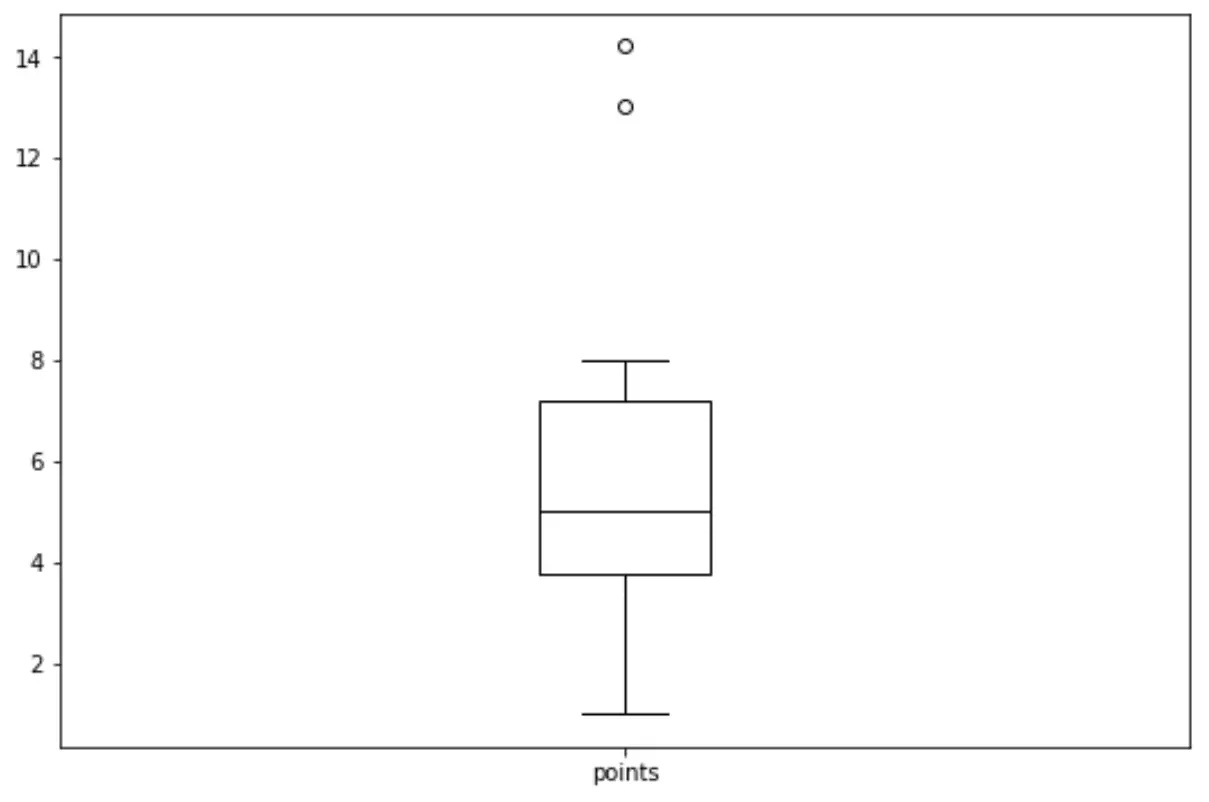
関連: Pandas DataFrame から箱ひげ図を作成する方法
次の構文を使用して、「points」変数のヒストグラムを作成できます。
 import matplotlib. pyplot as plt

df. hist (column=' points ', grid= False , edgecolor=' black ')
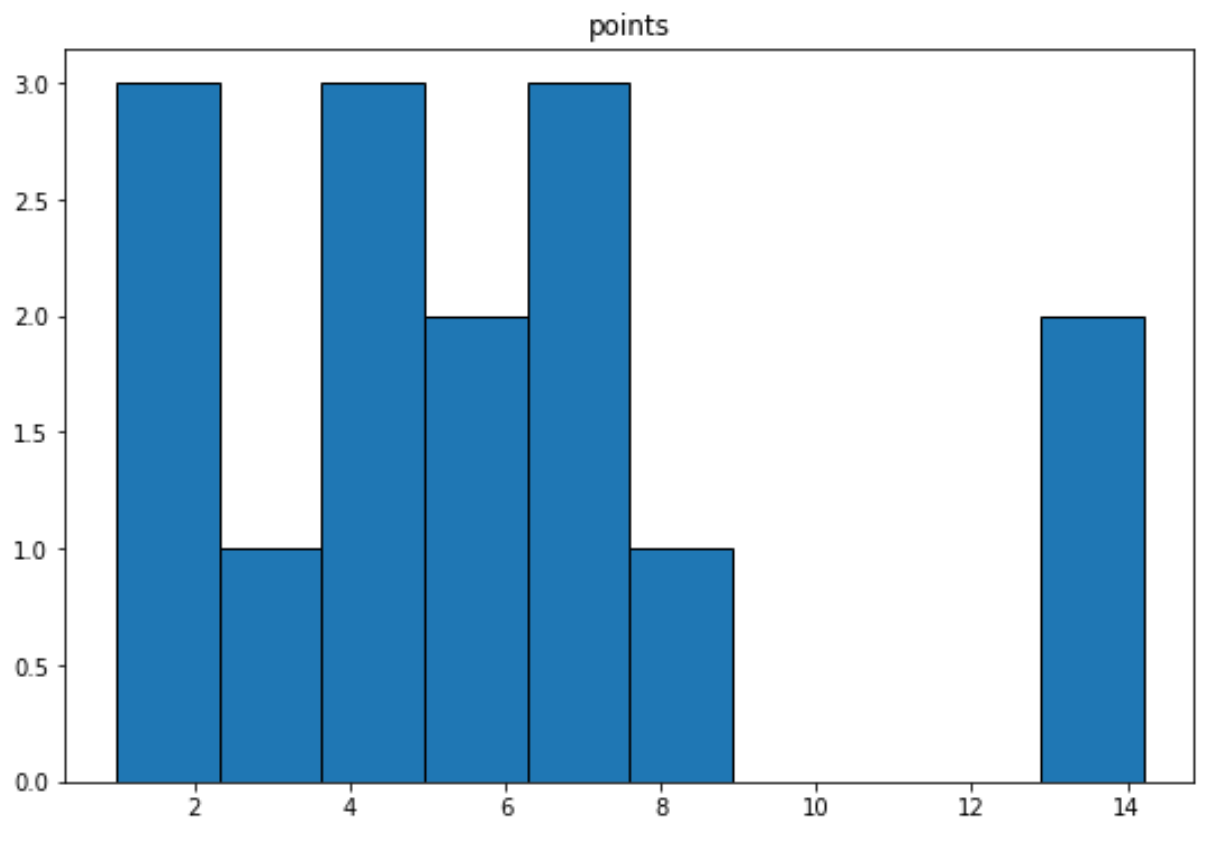
関連: Pandas DataFrame からヒストグラムを作成する方法
次の構文を使用して、「points」変数の密度曲線を作成できます。
 import seaborn as sns

sns. kdeplot (df[' points '])
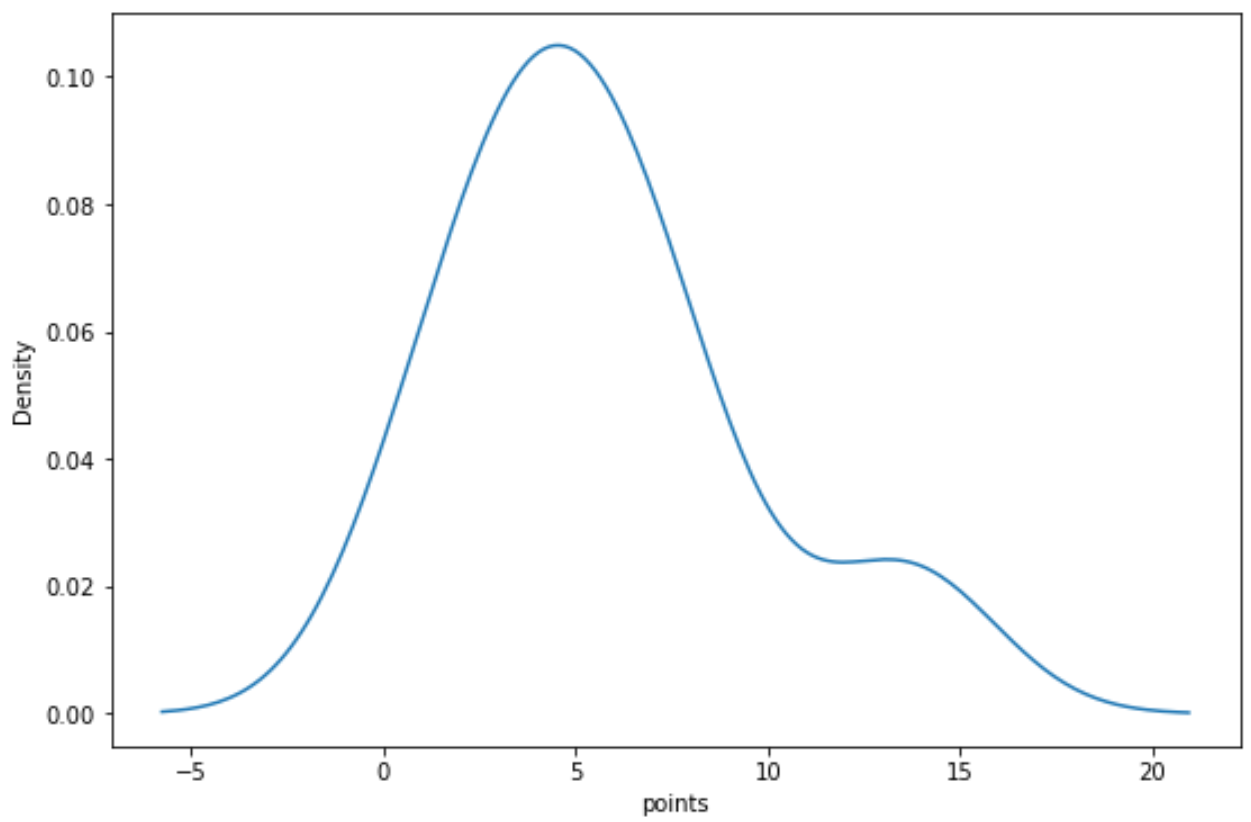
これらの各グラフは、「ポイント」変数の値の分布を視覚化する独自の方法を提供します。
著者について
ベンジャミン・アンダーソン博士
私はベンジャミンです。退職した統計教授から、専任の Statorials 教育者になりました。 統計分野における豊富な経験と専門知識を活かして、私は Statorials を通じて学生に力を与えるために自分の知識を共有することに尽力しています。もっと知る