Python でデータのリストからヒストグラムをプロットする方法
次の基本構文を使用して、Python でデータのリストからヒストグラムをプロットできます。
 import matplotlib. pyplot as plt

#create list of data
x = [2, 4, 4, 5, 6, 6, 7, 8, 14]

#create histogram from list of data
plt. hist (x,bins= 4 )
次の例は、この構文を実際に使用する方法を示しています。
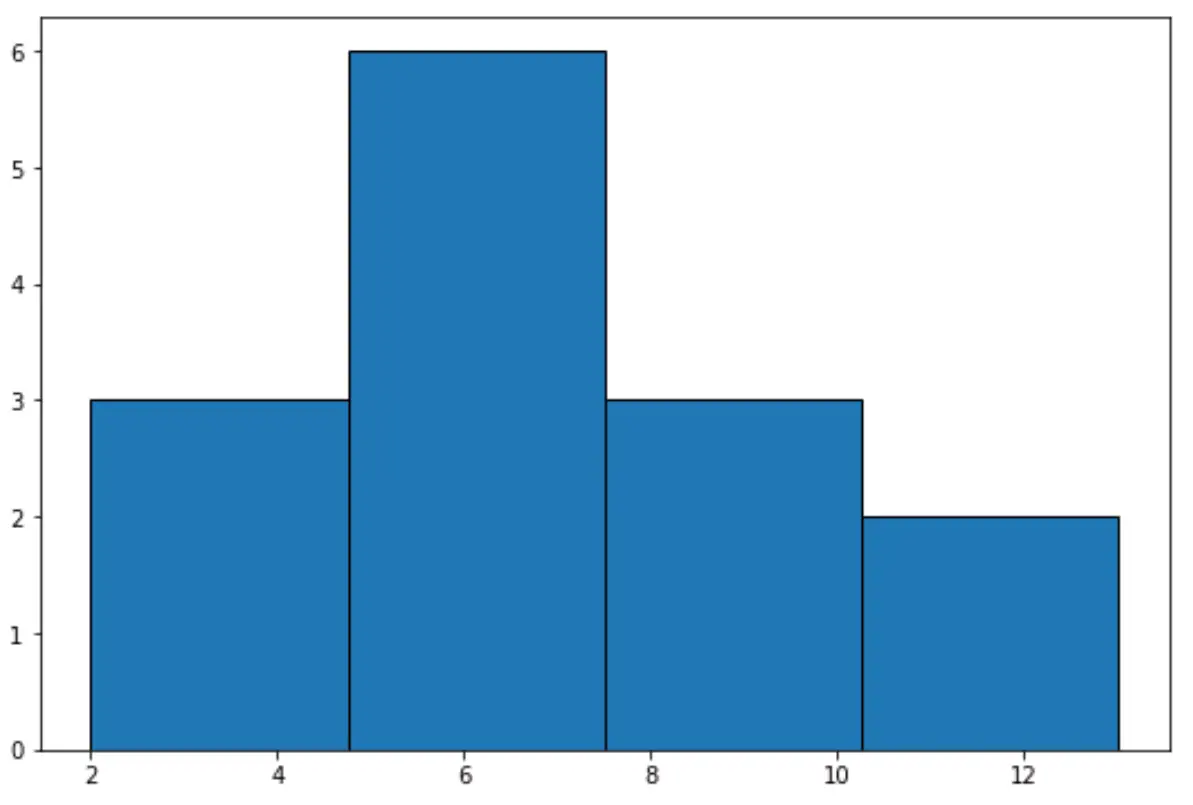
例 1: 固定数のビンを使用してヒストグラムを作成する
次のコードは、固定数のボックスを使用して、データのリストからヒストグラムを作成する方法を示しています。
 import matplotlib. pyplot as plt

#create list of data
x = [2, 4, 4, 5, 6, 6, 7, 7, 7, 8, 8, 8, 12, 13]

#create histogram with 4 bins
plt. hist (x, bins= 4 , edgecolor=' black ')
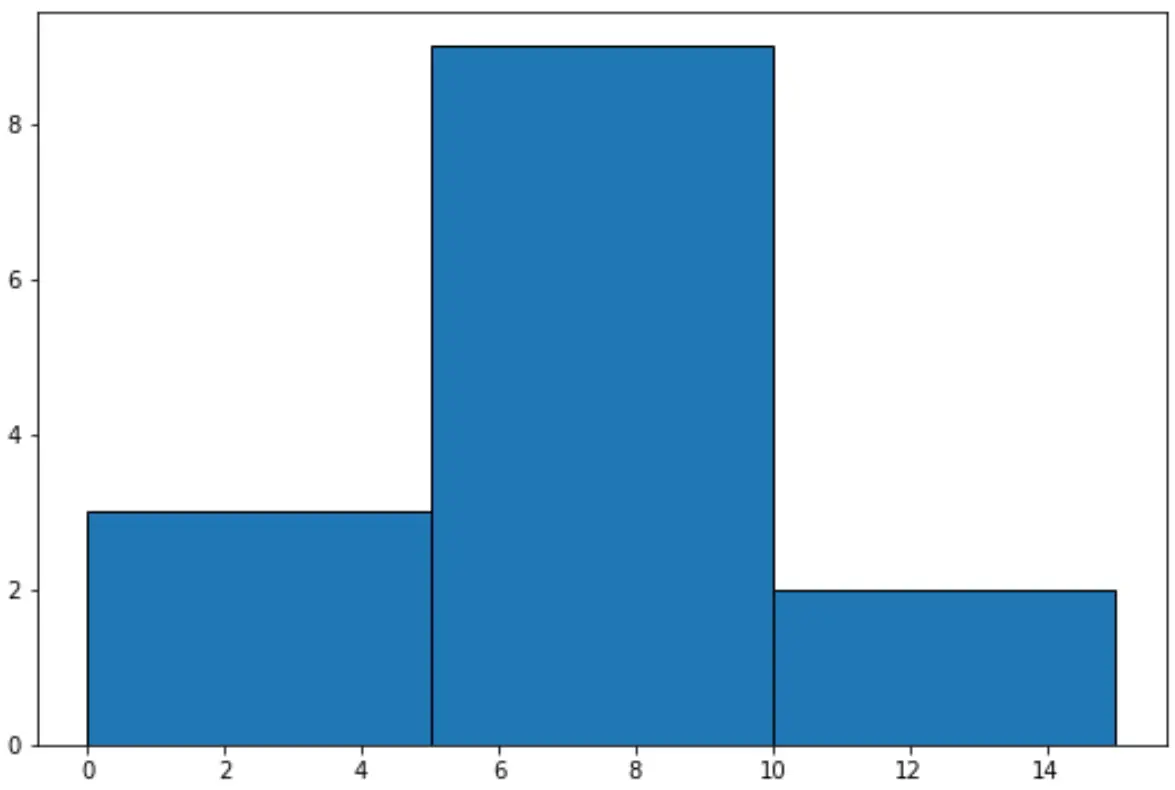
例 2: 特定のビン範囲を使用してヒストグラムを作成する
次のコードは、指定されたボックス範囲を使用して、データのリストからヒストグラムを作成する方法を示しています。
 import matplotlib. pyplot as plt

#create list of data
x = [2, 4, 4, 5, 6, 6, 7, 7, 7, 8, 8, 8, 12, 13]

#specify bin start and end points
bin_ranges = [0, 5, 10, 15]

#create histogram with 4 bins
plt. hist (x, bins=bin_ranges, edgecolor=' black ')
Matplotlib ヒストグラム関数の完全なドキュメントは、ここで見つけることができます。
追加リソース
次のチュートリアルでは、Matplotlib でその他のよく使用されるグラフを作成する方法を説明します。
Matplotlib で時系列をプロットする方法
Matplotlib でグループごとに箱ひげ図を作成する方法
Matplotlib でプロット サイズを増やす方法
著者について
ベンジャミン・アンダーソン博士
私はベンジャミンです。退職した統計教授から、専任の Statorials 教育者になりました。 統計分野における豊富な経験と専門知識を活かして、私は Statorials を通じて学生に力を与えるために自分の知識を共有することに尽力しています。もっと知る