Python で rnorm() と同等のものを使用する方法
R プログラミング言語では、 rnorm()関数を使用して、特定の平均と標準偏差を持つ正規分布に従うランダムな値のベクトルを生成できます。
たとえば、次のコードは、 rnorm()を使用して、平均 5、標準偏差 2 の正規分布に従う 8 つのランダム値のベクトルを作成する方法を示しています。
 #make this example reproducible
set. seeds (1)

#generate vector of 8 values that follows normal distribution with mean=5 and sd=2
rnorm(n=8, mean=5, sd=2)

[1] 3.747092 5.367287 3.328743 8.190562 5.659016 3.359063 5.974858 6.476649
Python のrnorm()関数に相当するのはnp.random.normal()関数で、次の基本構文を使用します。
np.random.normal(loc=0、scale=1、size=なし)
金:
- loc : 分布の平均
- スケール: 分布の標準偏差
- サイズ:サンプルサイズ
次の例は、この関数を実際に使用する方法を示しています。
例: Python の rnorm() に相当するものを使用する
次のコードは、 np.random.normal()関数を使用して、特定の平均と標準偏差を持つ正規分布に従うランダムな値の配列を生成する方法を示しています。
 import numpy as np

#make this example reproducible
n.p. random . seeds (1)

#generate array of 8 values that follow normal distribution with mean=5 and sd=2
n.p. random . normal (loc=5, scale=2, size=8)

array([8.24869073, 3.77648717, 3.9436565, 2.85406276, 6.73081526,
       0.39692261, 8.48962353, 3.4775862 ])
結果は、平均 5、標準偏差 2 の正規分布から生成された 8 つの値を含む NumPy 配列になります。
Matplotlib を使用してヒストグラムを作成し、 np.random.normal()関数によって生成された正規分布を視覚化することもできます。
 import numpy as np
import matplotlib. pyplot as plt

#make this example reproducible
n.p. random . seeds (1)

#generate array of 200 values that follows normal distribution with mean=5 and sd=2
data = np. random . normal (loc=5, scale=2, size=200)

#create histogram to visualize distribution of values
plt. hist (data, bins=30, edgecolor=' black ')
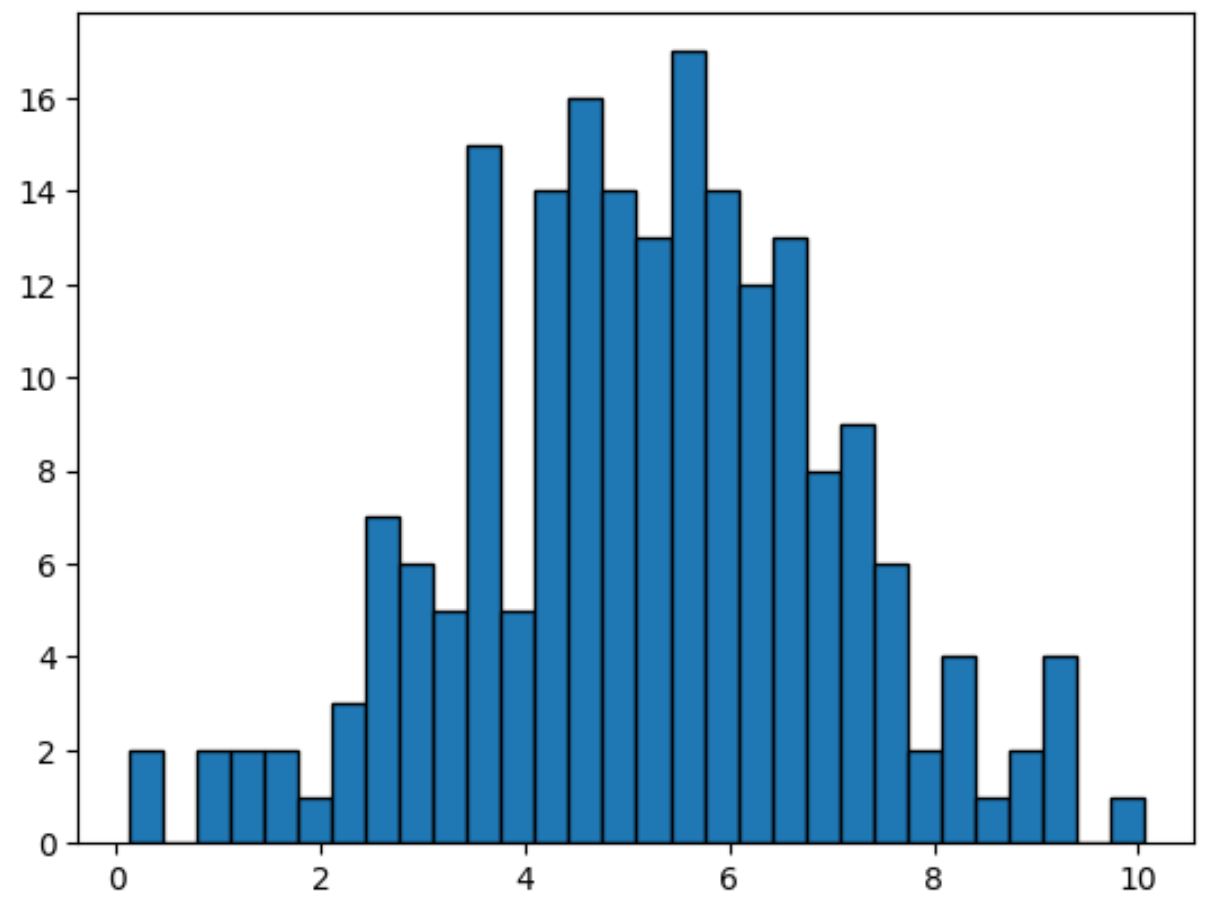
値の分布は、平均が 5、標準偏差が 2 のほぼ釣鐘型であることがわかります。
注: np.random.normal()関数の完全なドキュメントはここで見つけることができます。
追加リソース
次のチュートリアルでは、Python で他の一般的な操作を実行する方法について説明します。
Python で正規 CDF を計算してプロットする方法
Python で正規分布をプロットする方法
Python で正規性をテストする方法
著者について
ベンジャミン・アンダーソン博士
私はベンジャミンです。退職した統計教授から、専任の Statorials 教育者になりました。 統計分野における豊富な経験と専門知識を活かして、私は Statorials を通じて学生に力を与えるために自分の知識を共有することに尽力しています。もっと知る