R でロジスティック回帰曲線をプロットする方法
多くの場合、近似ロジスティック回帰モデルの曲線を R でプロットしたい場合があります。
幸いなことに、これを行うのは非常に簡単で、このチュートリアルではベース R と ggplot2 の両方でそれを行う方法を説明しています。
例: 底 R でのロジスティック回帰曲線の描画
次のコードは、R の組み込み mtcars データセットの変数を使用してロジスティック回帰モデルを近似する方法と、ロジスティック回帰曲線をプロットする方法を示しています。
 #fit logistic regression model
model <- glm(vs ~ hp, data=mtcars, family=binomial)

#define new data frame that contains predictor variable
newdata <- data. frame (hp=seq(min(mtcars$hp), max(mtcars$hp),len= 500 ))

#use fitted model to predict values of vs
newdata$vs = predict(model, newdata, type=" response ")

#plot logistic regression curve
plot(vs ~hp, data=mtcars, col=" steelblue ")
lines(vs ~ hp, newdata, lwd= 2 )

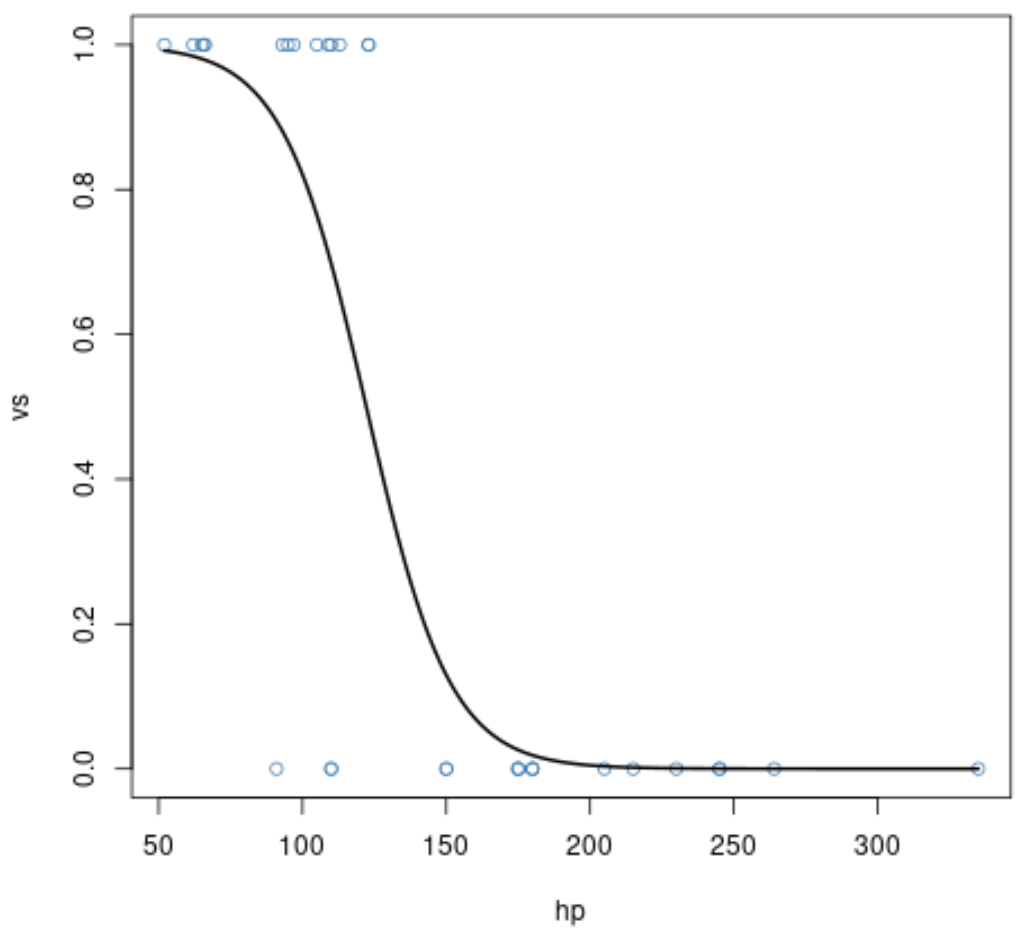
x 軸は予測変数hpの値を表示し、y 軸は応答変数amの予測確率を表示します。
予測変数hpの値が高いほど、応答変数vsが 1 に等しい確率が低いことに関連していることがはっきりとわかります。
例: ggplot2 でのロジスティック回帰曲線のプロット
次のコードは、同じロジスティック回帰モデルを近似する方法と、 ggplot2データ視覚化ライブラリを使用してロジスティック回帰曲線をプロットする方法を示しています。
 library (ggplot2)

#plot logistic regression curve
ggplot(mtcars, aes (x=hp, y=vs)) +
  geom_point(alpha=.5) +
  stat_smooth(method=" glm ", se=FALSE, method. args = list(family=binomial))

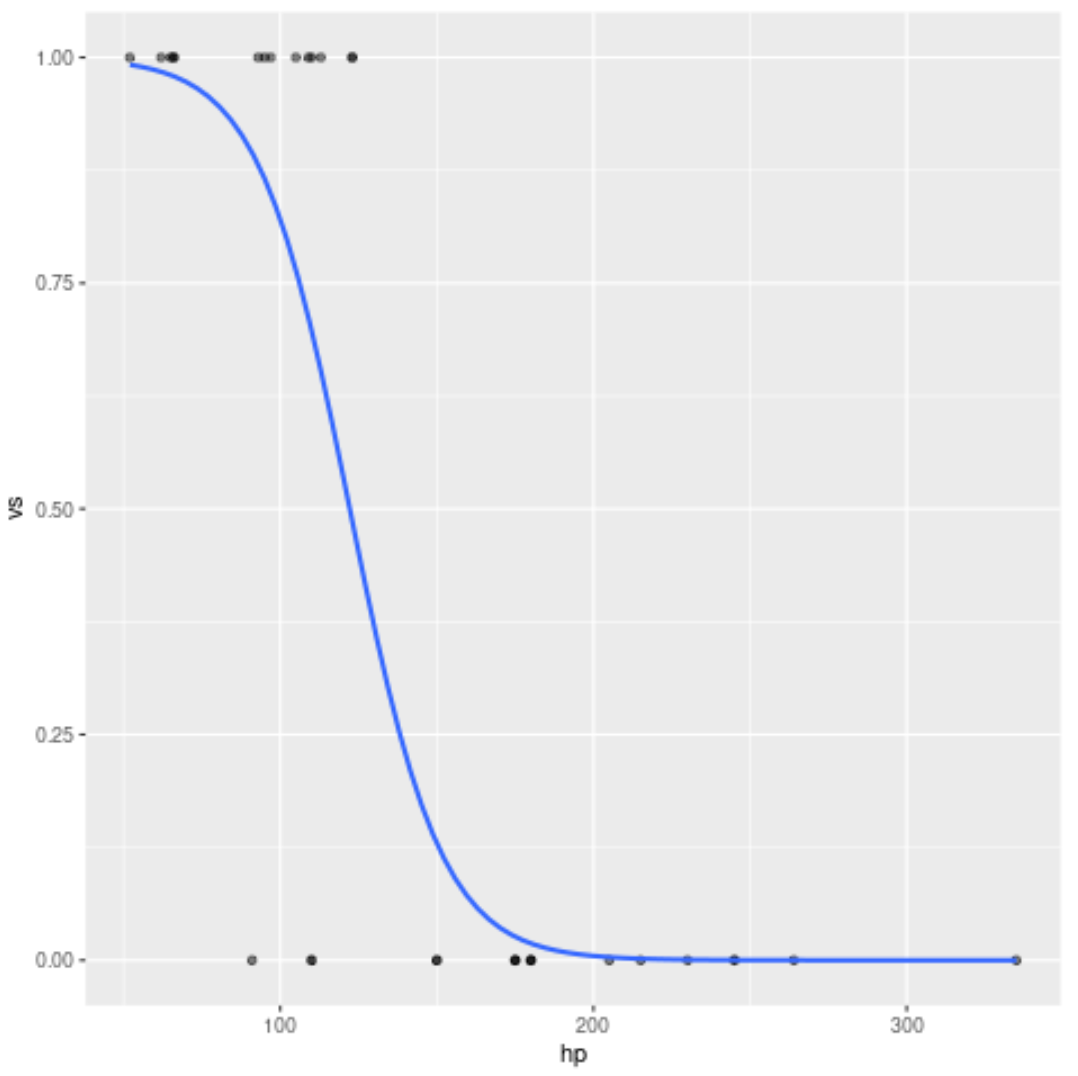
これは、R ベースを使用して前の例で生成された曲線とまったく同じであることに注意してください。
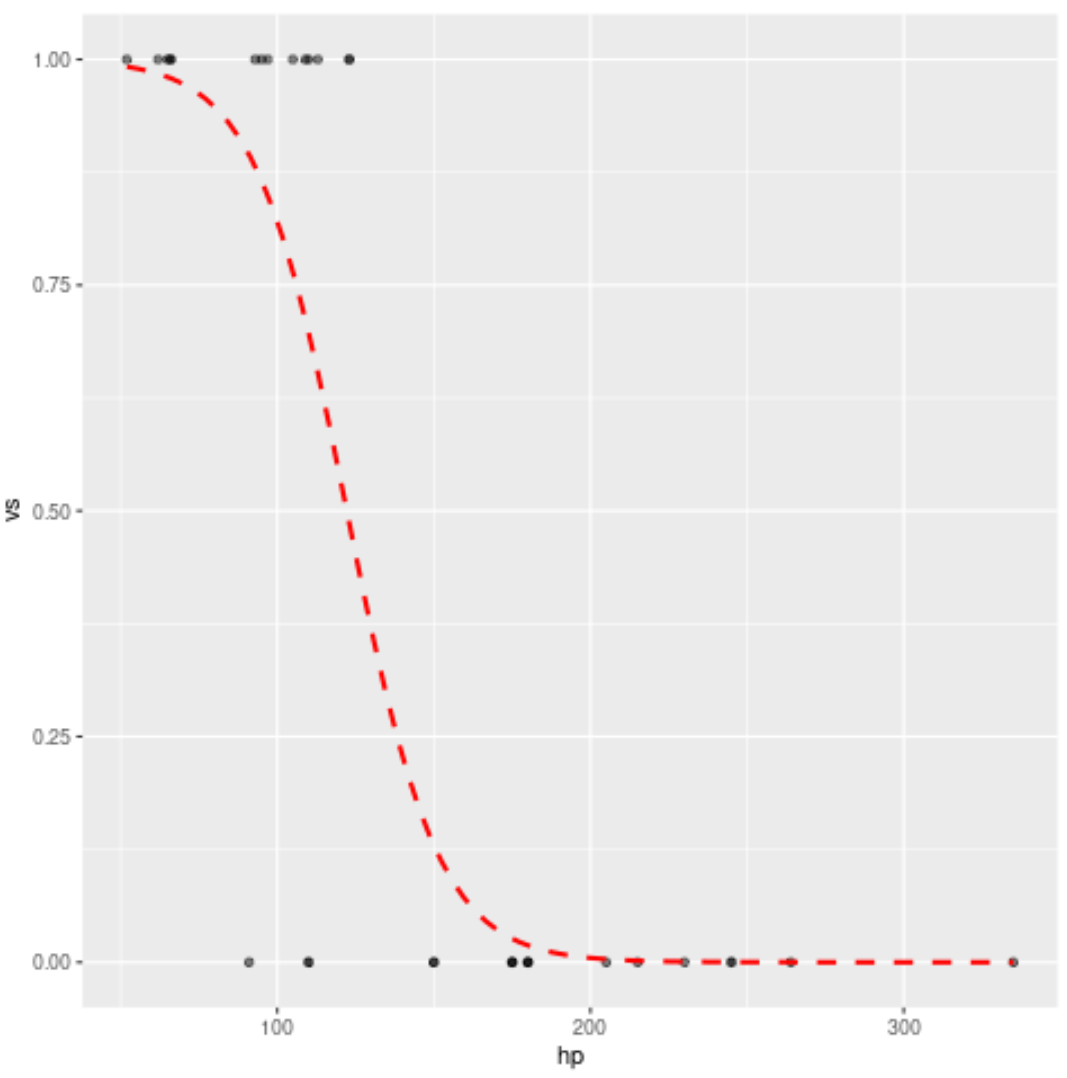
曲線のスタイルも自由に変更してください。たとえば、曲線を赤い点線に変えることができます。
 library (ggplot2)

#plot logistic regression curve
ggplot(mtcars, aes (x=hp, y=vs)) +
  geom_point(alpha=.5) +
  stat_smooth(method=" glm ", se=FALSE, method. args = list(family=binomial),
              col=" red ", lty= 2 )

追加リソース
ロジスティック回帰の概要
R でロジスティック回帰を実行する方法 (ステップバイステップ)
Python でロジスティック回帰を実行する方法 (ステップバイステップ)
Rでseq関数を使用する方法