R で同じグラフに複数のプロットをプロットする方法 (3 つの例)
次のメソッドを使用して、R の同じグラフ上に複数のプロットを描画できます。
方法 1: 同じグラフ上に複数の線を描画する
 #plot first line
plot(x, y1, type=' l ')

#add second line to plot
lines(x, y2)
方法 2: 複数のパスを並べて作成する
 #define plotting area as one row and two columns
by(mfrow = c(1, 2))

#create first plot
plot(x, y1, type=' l ')

#create second plot
plot(x, y2, type=' l ')
方法 3: 複数の垂直積み上げプロットを作成する
 #define plotting area as two rows and one column
by(mfrow = c(2, 1))

#create first plot
plot(x, y1, type=' l ')

#create second plot
plot(x, y2, type=' l ')
次の例は、各メソッドを実際に使用する方法を示しています。
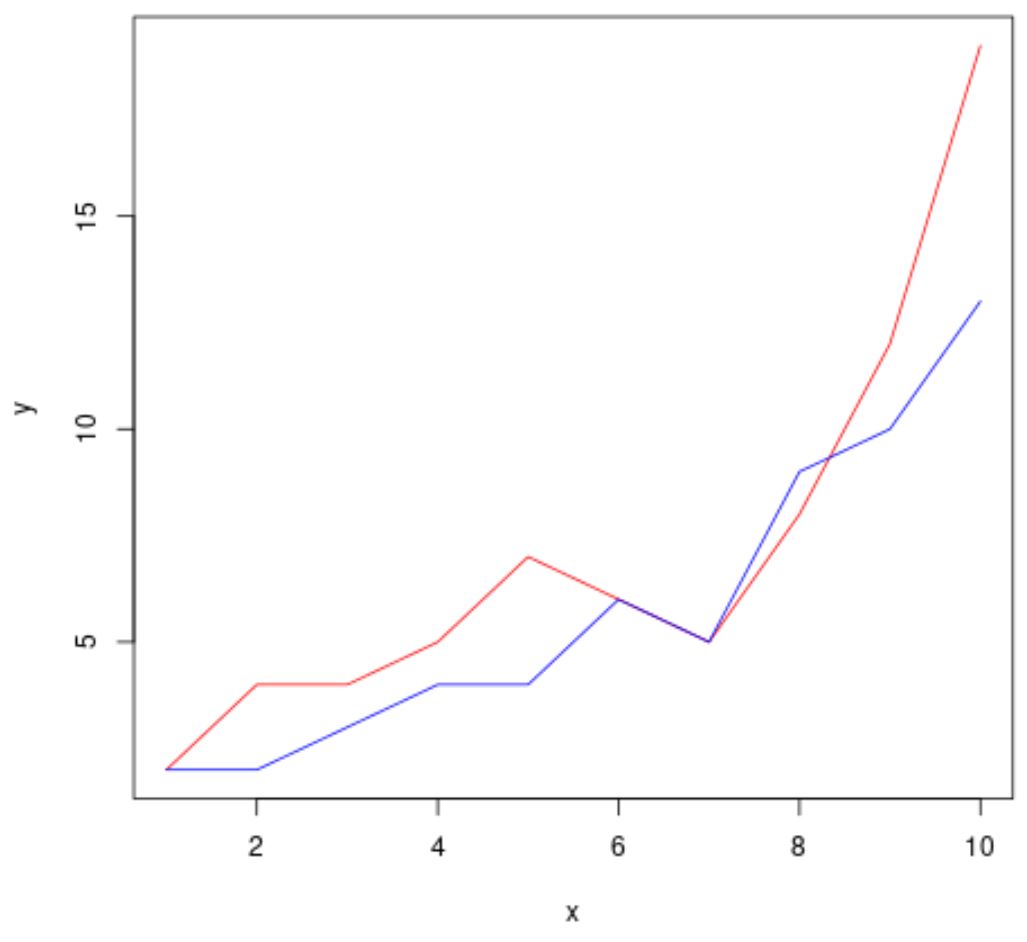
例 1: 同じグラフ上に複数の線を描画する
次のコードは、R で同じグラフ上に 2 本の線を描画する方法を示しています。
 #define data to plot
x <- 1:10
y1 <- c(2, 4, 4, 5, 7, 6, 5, 8, 12, 19)
y2 <- c(2, 2, 3, 4, 4, 6, 5, 9, 10, 13)

#plot first line
plot(x, y1, type=' l ', col=' red ', xlab=' x ', ylab=' y ')

#add second line to plot
lines(x, y2, col=' blue ')

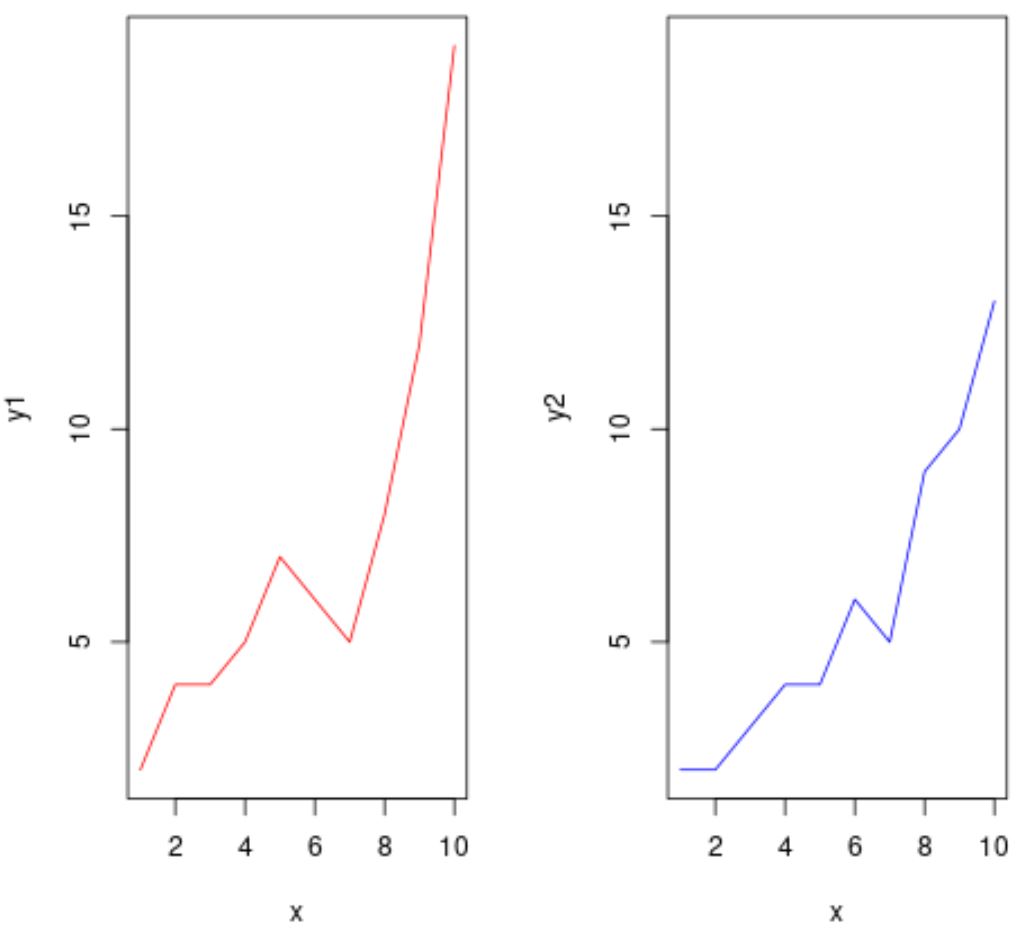
例 2: 複数のパスを並べて作成する
次のコードは、 par()引数を使用して複数のプロットを並べてプロットする方法を示しています。
 #define data to plot
x <- 1:10
y1 <- c(2, 4, 4, 5, 7, 6, 5, 8, 12, 19)
y2 <- c(2, 2, 3, 4, 4, 6, 5, 9, 10, 13)

#define plotting area as one row and two columns
by(mfrow = c(1, 2))

#create first line plot
plot(x, y1, type=' l ', col=' red ')

#create second line plot
plot(x, y2, type=' l ', col=' blue ', ylim=c(min(y1), max(y1)))

2 番目のプロットでylim()引数を使用して、両方のプロットの y 軸上の制限が同じになるようにしたことに注意してください。
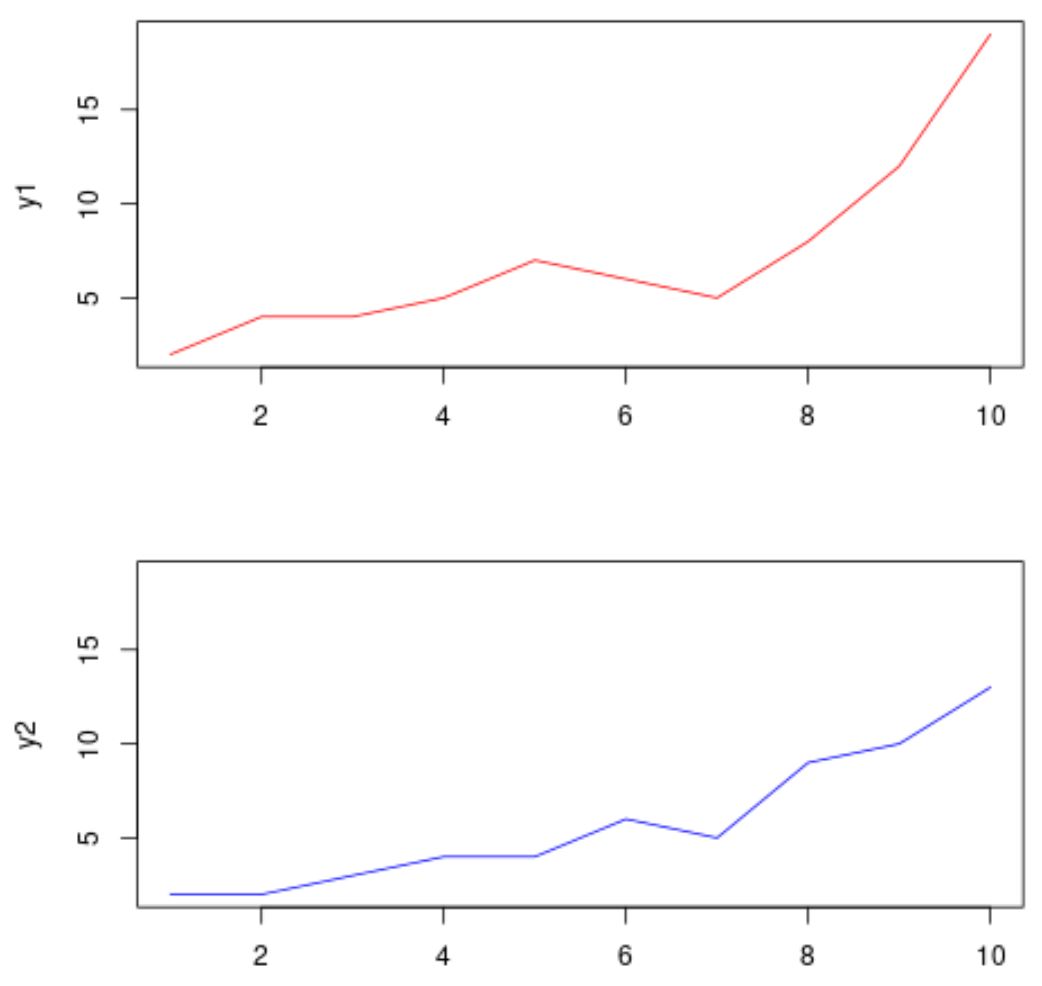
例 3: 複数の垂直積み上げプロットの作成
次のコードは、 par()引数を使用して複数の垂直方向に積み上げられたプロットをプロットする方法を示しています。
 #define data to plot
x <- 1:10
y1 <- c(2, 4, 4, 5, 7, 6, 5, 8, 12, 19)
y2 <- c(2, 2, 3, 4, 4, 6, 5, 9, 10, 13)

#define plotting area as two rows and one column
par(mfrow = c(2, 1), mar = c(2, 4, 4, 2))
#create first line plot
plot(x, y1, type=' l ', col=' red ')

#create second line plot
plot(x, y2, type=' l ', col=' blue ', ylim=c(min(y1), max(y1)))

プロット領域のマージン (下、左、上、右) を指定するためにmar引数を使用したことに注意してください。
注:デフォルトは mar = c(5.1, 4.1, 4.1, 2.1) です。
追加リソース
次のチュートリアルでは、R で他の一般的なタスクを実行する方法について説明します。