R での修正方法:plot.new はまだ呼び出されていません
R を使用するときに発生する可能性のあるエラーは次のとおりです。
 Error in plot.xy(xy.coords(x, y), type = type, ...):
  plot.new has not been called yet
このエラーは、プロットが R にすでに存在している必要があるアクションを実行しようとしたが、プロットが存在しない場合に発生します。
次の例は、このエラーを実際に修正する方法を示しています。
例 1: Lines() を使用してエラーを修正する方法
R で近似回帰直線をプロットしようとしているとします。
 #createdata
df <- data. frame (x=c(1, 2, 2, 3, 5, 6, 8, 8, 9, 9, 10, 11, 12, 15, 15),
                 y=c(2, 3, 3, 4, 5, 5, 6, 7, 8, 8, 9, 10, 16, 19, 28))

#fit polynomial regression model
model <- lm(y~poly(x, 2), data=df)

#define new sequence of x-values
new_x <- seq(min(df$x), max(df$y))

#attempt to plot fitted regression line
lines(new_x, predict(model, newdata = data. frame (x=new_x)))

Error in plot.xy(xy.coords(x, y), type = type, ...):
  plot.new has not been called yet
最初に R でパスを作成しないとlines()関数を使用できないため、エラーが発生します。
このエラーを修正するには、まず散布図を作成してから、 lines()関数を使用します。
 #create data
df <- data. frame (x=c(1, 2, 2, 3, 5, 6, 8, 8, 9, 9, 10, 11, 12, 15, 15),
                 y=c(2, 3, 3, 4, 5, 5, 6, 7, 8, 8, 9, 10, 16, 19, 28))

#fit polynomial regression model
model <- lm(y~poly(x, 2), data=df)

#define new sequence of x-values
new_x <- seq(min(df$x), max(df$y))

#create scatterplot of x vs. y values
plot(y~x, data=df)

#attempt to plot fitted regression line
lines(new_x, predict(model, newdata = data. frame (x=new_x)))
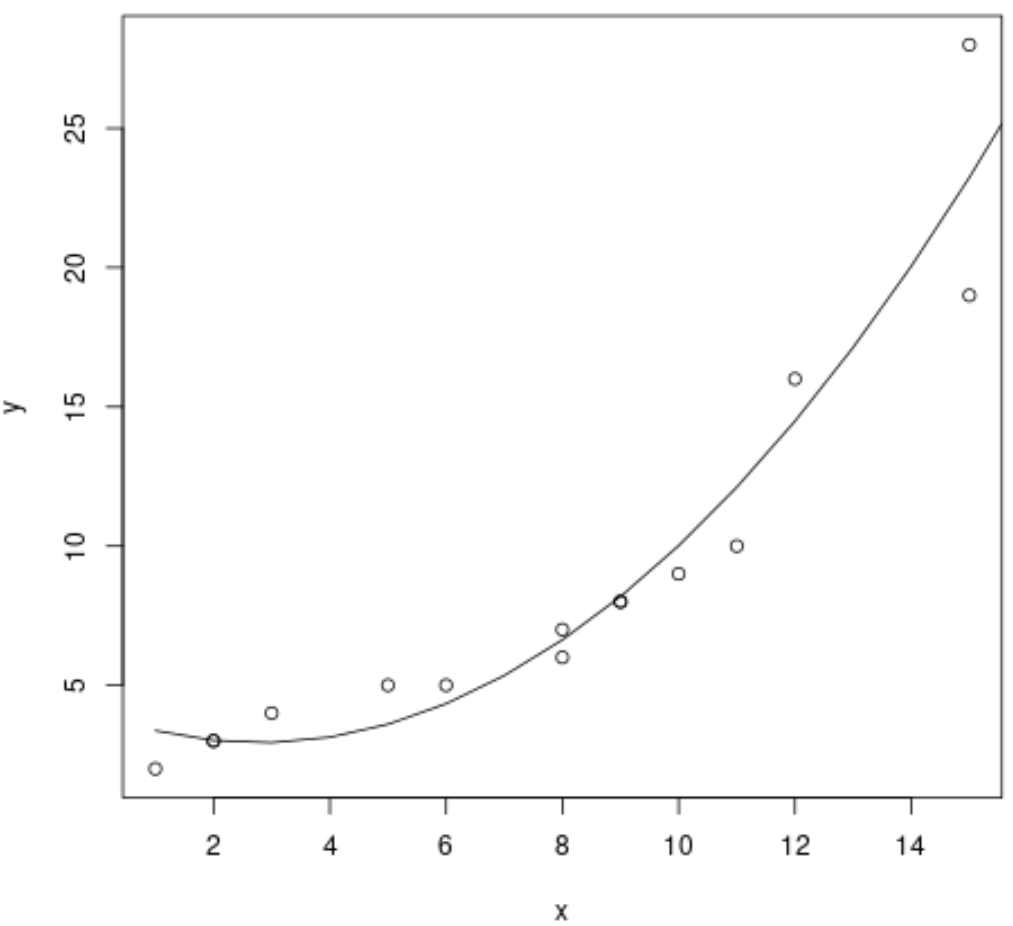
Lines()関数を使用する前に最初にLot()関数を使用したため、エラーが発生していないことに注意してください。
例 2: abline() でエラーを修正する方法
R で水平の直線を持つ散布図を作成しようとしているとします。
 #create data
df <- data. frame (x=c(1, 2, 2, 3, 5, 6, 8, 8, 9, 9, 10, 11, 12, 15, 15),
                 y=c(2, 3, 3, 4, 5, 5, 6, 7, 8, 8, 9, 10, 16, 19, 28))

#attempt to add horizontal line at y=10
abline(a=10, b=0, lwd=2)

Error in plot.xy(xy.coords(x, y), type = type, ...):
  plot.new has not been called yet
最初に R でプロットを作成しないとabline()関数を使用できないため、エラーが発生します。
このエラーを修正するには、まず散布図を作成し、次にabline()関数を使用します。
 #createdata
df <- data. frame (x=c(1, 2, 2, 3, 5, 6, 8, 8, 9, 9, 10, 11, 12, 15, 15),
                 y=c(2, 3, 3, 4, 5, 5, 6, 7, 8, 8, 9, 10, 16, 19, 28))

#create scatterplot of x vs. y
plot(y~x, data=df)

#add horizontal line at y=10
abline(a=10, b=0, lwd=2)
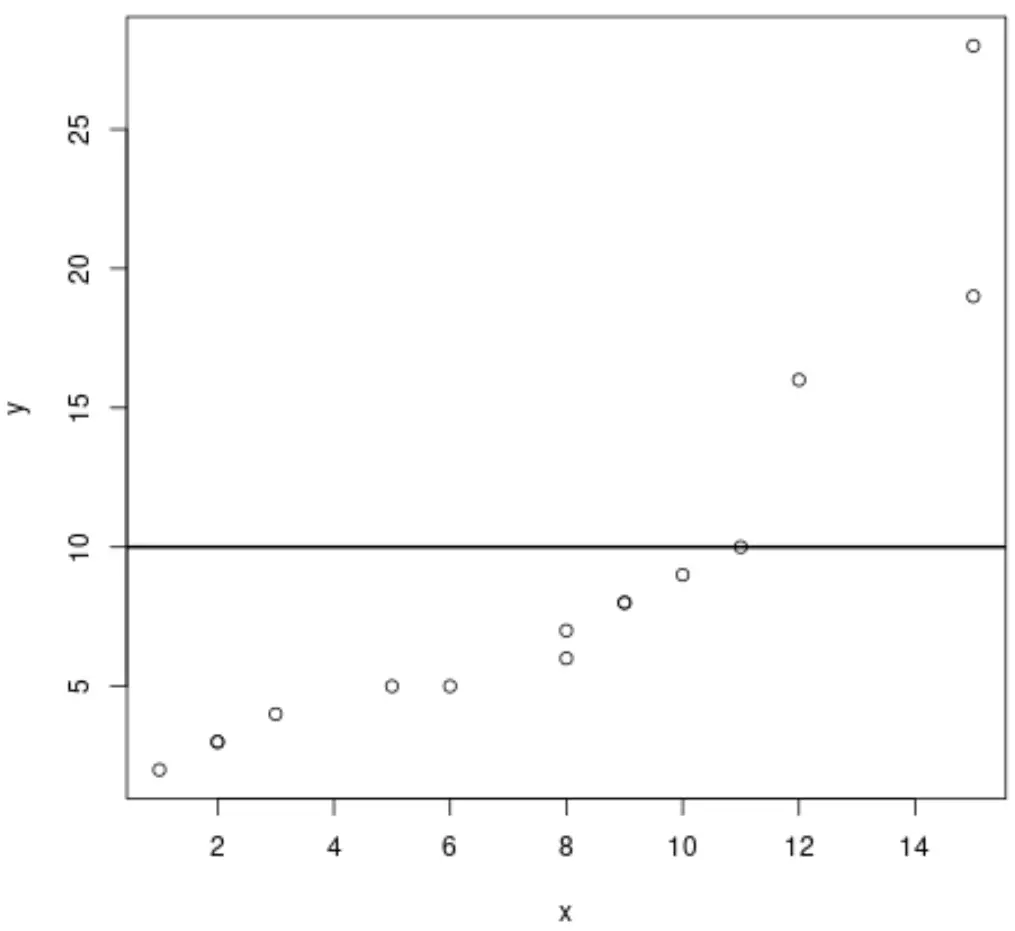
abline()関数を使用する前に最初にplot()関数を使用したため、エラーが発生していないことに注意してください。
関連: R で aline() を使用してパスに直線を追加する方法
追加リソース
次のチュートリアルでは、R の他の一般的なエラーを修正する方法について説明します。
R での修正方法: 予期しない文字列定数
R での修正方法: ExtractVars の無効なテンプレート式
R で修正する方法: 引数が数値でも論理でもない: na を返す
著者について
ベンジャミン・アンダーソン博士
私はベンジャミンです。退職した統計教授から、専任の Statorials 教育者になりました。 統計分野における豊富な経験と専門知識を活かして、私は Statorials を通じて学生に力を与えるために自分の知識を共有することに尽力しています。もっと知る