R のプロットに上付き文字と下付き文字を追加する方法
次の基本構文を使用して、R のプロットに上付き文字または下付き文字を追加できます。
 #define expression with superscript
x_expression <- expression(x^ 3 ~ variable ~ label)

#define expression with subscript
y_expression <- expression(y[ 3 ] ~ variable ~ label)

#add expressions to axis labels
plot(x, y, xlab = x_expression, ylab = y_expression)
次の例は、この構文を実際に使用する方法を示しています。
例 1: 軸ラベルに指数を追加する
次のコードは、R のプロットの軸ラベルに指数を追加する方法を示しています。
 #define data
x <- c(1, 2, 3, 4, 5, 6, 7, 8)
y <- c(9, 12, 14, 16, 15, 19, 26, 29)

#define x and y-axis labels with superscripts
x_expression <- expression(x^3 ~ variable ~ label)
y_expression <- expression(y^3 ~ variable ~ label)

#createplot
plot(x, y, xlab = x_expression, ylab = y_expression)
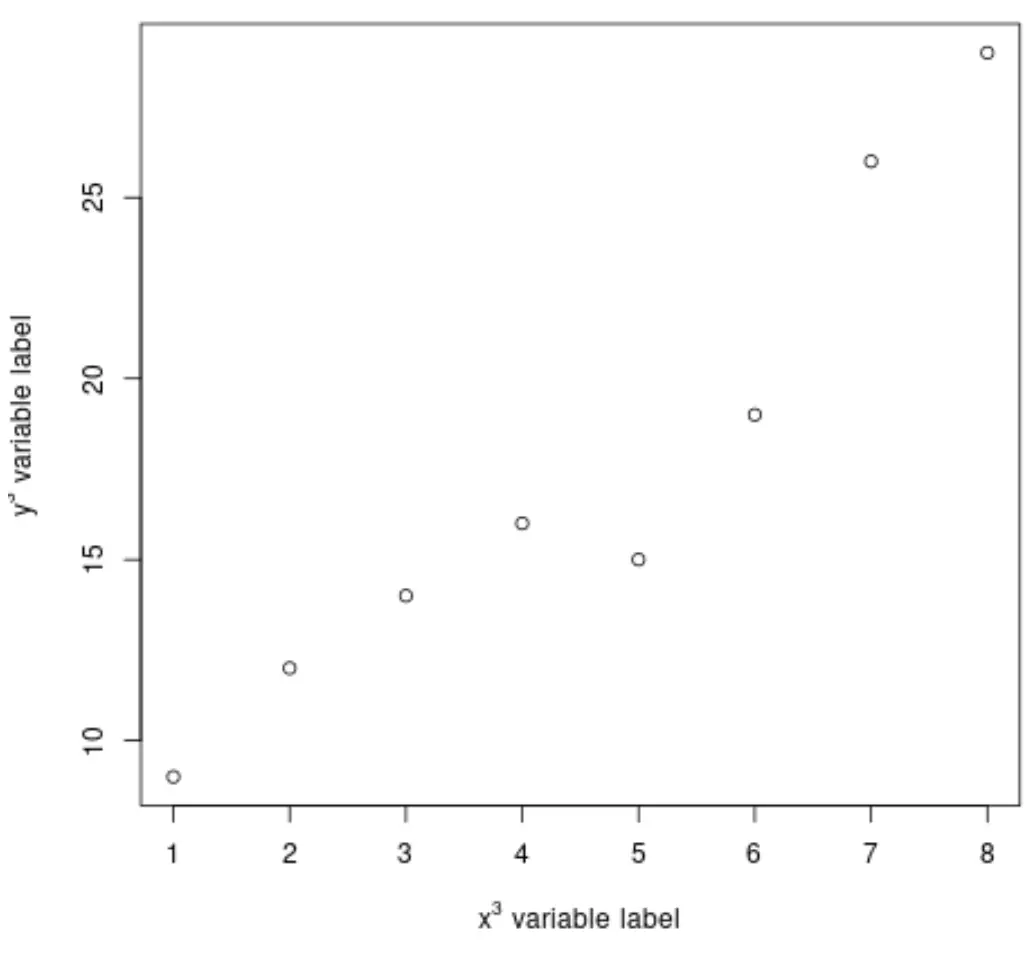
X 軸と Y 軸の両方のラベルに指数が含まれていることに注意してください。
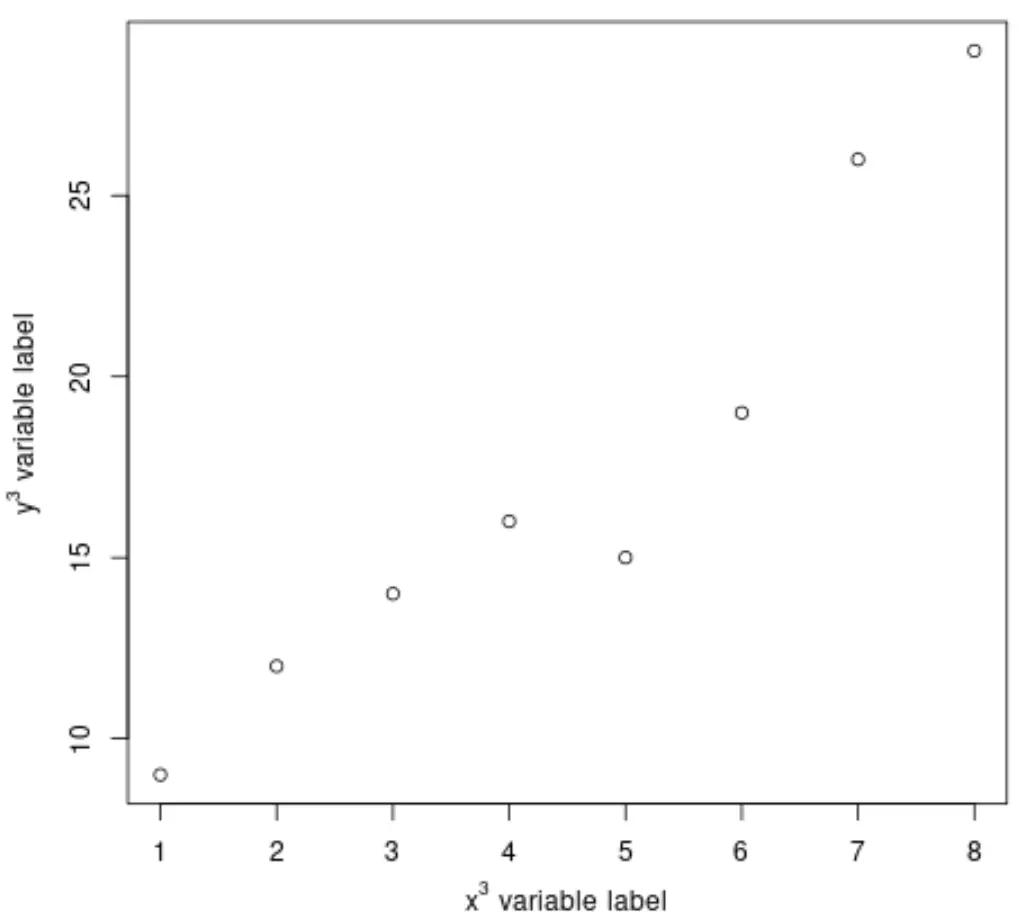
プロットでは、y 軸の指数が少し切り取られています。ラベルをプロットの軸に近づけるには、R でpar()関数を使用できます。
 #adjust by values (default is (3, 0, 0))
by(mgp=c(2.5, 1, 0))

#createplot
plot(x, y, xlab = x_expression, ylab = y_expression)
注: 指数として配置するランダムな値として「3」を選択しました。任意の数値または文字を上付き文字として自由に配置できます。
例 2: 軸ラベルに添字を追加する
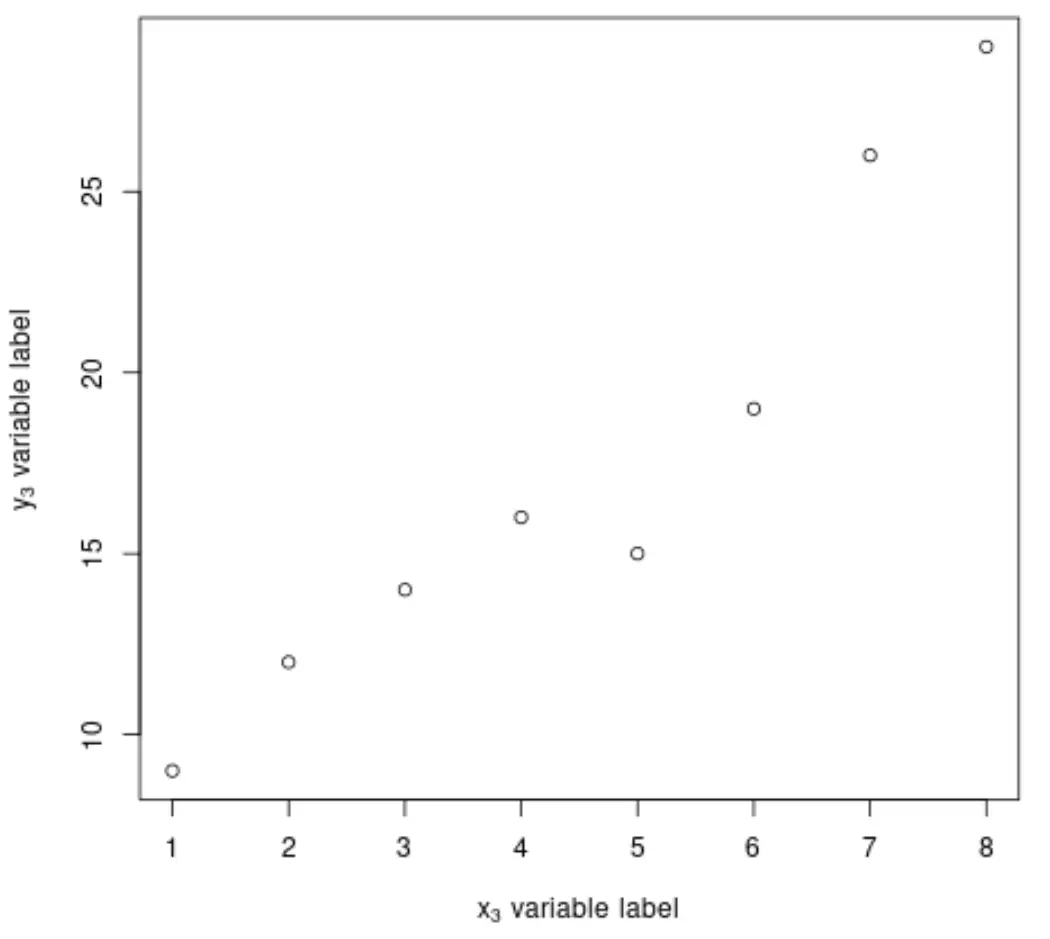
次のコードは、R のプロットの軸ラベルにインデックスを追加する方法を示しています。
 #define data
x <- c(1, 2, 3, 4, 5, 6, 7, 8)
y <- c(9, 12, 14, 16, 15, 19, 26, 29)

#define x and y-axis labels with superscripts
x_expression <- expression(x[3] ~ variable ~ label)
y_expression <- expression(y[3] ~ variable ~ label)

#createplot
plot(x, y, xlab = x_expression, ylab = y_expression)
例 3: プロット内に上付き文字と下付き文字を追加する
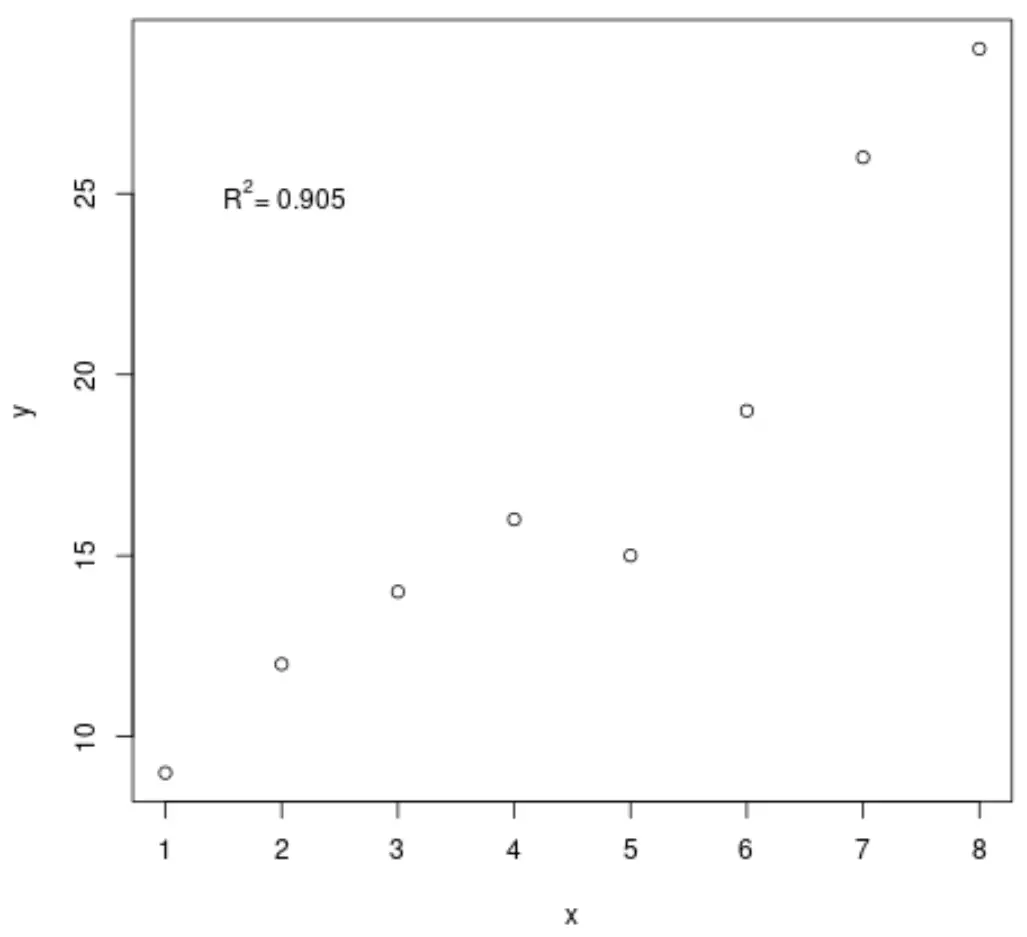
次のコードは、パス内のテキスト要素に上付き文字を追加する方法を示しています。
 #define data
x <- c(1, 2, 3, 4, 5, 6, 7, 8)
y <- c(9, 12, 14, 16, 15, 19, 26, 29)

#createplot
plot(x, y)

#define label with superscript to add to plot
R2_expression <- expression(paste(" ", R^2 , "= ", .905))

#add text to plot
text(x = 2, y = 25, label = R2_expression)
追加リソース
著者について
ベンジャミン・アンダーソン博士
私はベンジャミンです。退職した統計教授から、専任の Statorials 教育者になりました。 統計分野における豊富な経験と専門知識を活かして、私は Statorials を通じて学生に力を与えるために自分の知識を共有することに尽力しています。もっと知る