R の多変量適応回帰スプライン
多変量適応回帰スプライン(MARS) を使用すると、一連の予測変数と応答変数の間の非線形関係をモデル化できます。
この方法は次のように機能します。
1.データセットをk個の部分に分割します。
2.回帰モデルを各部分に当てはめます。
3. k 分割交差検証を使用してkの値を選択します。
このチュートリアルでは、MARS モデルを R のデータセットに適合させる方法の段階的な例を示します。
ステップ 1: 必要なパッケージをロードする
この例では、ISLR賃金データセットを使用します。 このパッケージには、3,000 人の年間給与と、年齢、教育、人種などのさまざまな予測変数が含まれています。
MARS モデルをデータに適合させる前に、必要なパッケージをロードします。
 library (ISLR) #contains Wage dataset
library (dplyr) #data wrangling
library (ggplot2) #plotting
library (earth) #fitting MARS models
library (caret) #tuning model parameters
ステップ 2: データを表示する
次に、作業しているデータセットの最初の 6 行を表示します。
 #view first six rows of data
head (Wage)

       year age maritl race education region
231655 2006 18 1. Never Married 1. White 1. < HS Grad 2. Middle Atlantic
86582 2004 24 1. Never Married 1. White 4. College Grad 2. Middle Atlantic
161300 2003 45 2. Married 1. White 3. Some College 2. Middle Atlantic
155159 2003 43 2. Married 3. Asian 4. College Grad 2. Middle Atlantic
11443 2005 50 4. Divorced 1. White 2. HS Grad 2. Middle Atlantic
376662 2008 54 2. Married 1. White 4. College Grad 2. Middle Atlantic
             jobclass health health_ins logwage wage
231655 1. Industrial 1. <=Good 2. No 4.318063 75.04315
86582 2. Information 2. >=Very Good 2. No 4.255273 70.47602
161300 1. Industrial 1. <=Good 1. Yes 4.875061 130.98218
155159 2. Information 2. >=Very Good 1. Yes 5.041393 154.68529
11443 2. Information 1. <=Good 1. Yes 4.318063 75.04315
376662 2. Information 2. >=Very Good 1. Yes 4.845098 127.11574
ステップ 3: MARS モデルの作成と最適化
次に、このデータセットの MARS モデルを作成し、k 分割相互検証を実行して、どのモデルが最も低いテスト RMSE (平均二乗誤差) を生成するかを決定します。
#create a tuning grid
hyper_grid <- expand. grid (degree = 1:3,
nprune = seq (2, 50, length.out = 10) %>%
floor ())
#make this example reproducible
set.seed(1)
#fit MARS model using k-fold cross-validation
cv_mars <- train(
x = subset(Wage, select = -c(wage, logwage)),
y = Wage$wage,
method = " earth ",
metric = " RMSE ",
trControl = trainControl(method = " cv ", number = 10),
tuneGrid = hyper_grid)
#display model with lowest test RMSE
cv_mars$results %>%
filter (nprune==cv_mars$bestTune$nprune, degree =cv_mars$bestTune$degree)
degree nprune RMSE Rsquared MAE RMSESD RsquaredSD MAESD
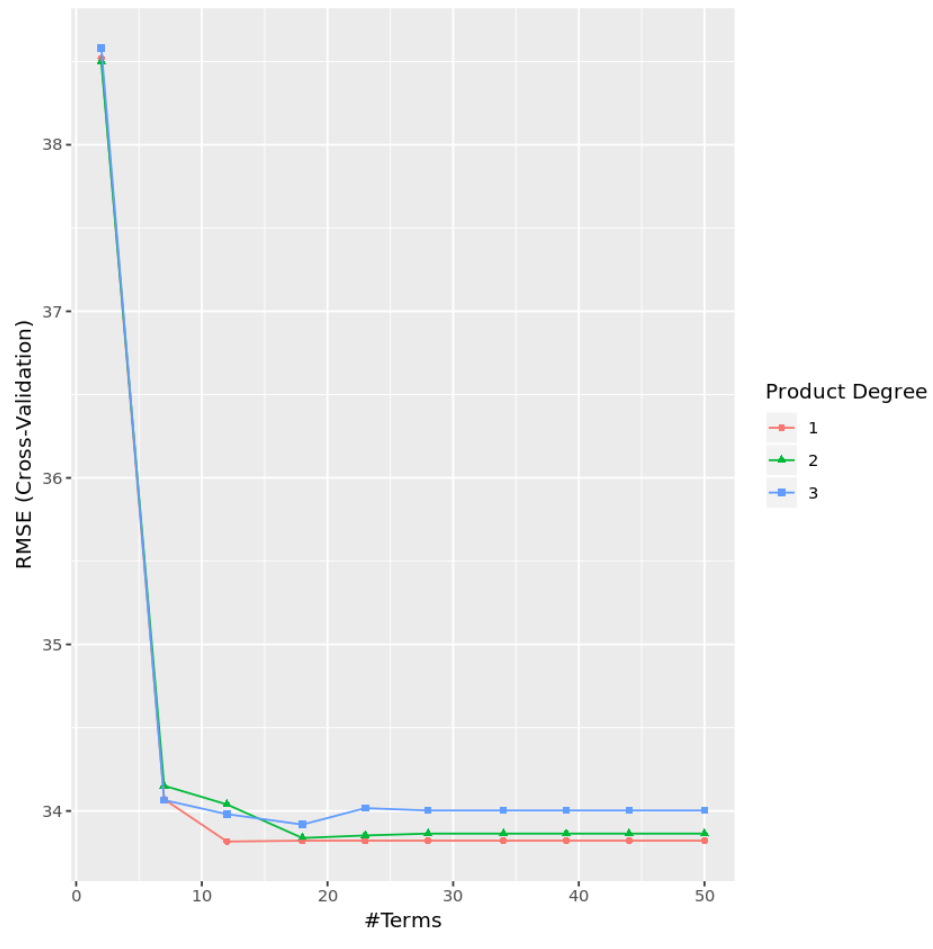
1 12 33.8164 0.3431804 22.97108 2.240394 0.03064269 1.4554
結果から、最も低いテスト MSE を生成したモデルは、一次効果のみ (交互作用項なし) と 12 項を持つモデルであることがわかります。このモデルでは、二乗平均平方根誤差 (RMSE) が33.8164となりました。
注: MARS モデルを指定するには、method=”earth” を使用しました。このメソッドのドキュメントはここにあります。
程度と用語数に基づいて RMSE テストを視覚化するグラフを作成することもできます。
 #display test RMSE by terms and degree
ggplot(cv_mars)
実際には、MARS モデルを次のような他のいくつかのタイプのモデルに適合させます。
次に、各モデルを比較してテスト誤差が最も低いモデルを判断し、そのモデルを使用する最適なモデルとして選択します。
この例で使用されている完全な R コードは、 ここにあります。
著者について
ベンジャミン・アンダーソン博士
私はベンジャミンです。退職した統計教授から、専任の Statorials 教育者になりました。 統計分野における豊富な経験と専門知識を活かして、私は Statorials を通じて学生に力を与えるために自分の知識を共有することに尽力しています。もっと知る