R でクラスター化棒グラフを作成する方法 (例付き)
グループ化棒グラフは、さまざまな変数の数量を別の変数ごとにグループ化して表示するグラフの一種です。
このチュートリアルでは、 ggplot2データ視覚化ライブラリを使用して、R でクラスター化された棒グラフを作成する方法について説明します。
ggplot2 でグループ化されたバープロット
9 人のバスケットボール選手の 1 試合あたりの平均得点を表示する次のデータ フレームがあるとします。
 #create data frame
df <- data.frame(team= rep (c(' A ', ' B ', ' C '), each =3),
                 position= rep (c(' Guard ', ' Forward ', ' Center '), times =3),
                 dots=c(14, 8, 8, 16, 3, 7, 17, 22, 26))

#view data frame
df

  team position points
1 A Guard 14
2 A Forward 8
3 A Center 8
4 B Guard 16
5 B Forward 3
6 B Center 7
7 C Guard 17
8 C Forward 22
9C Center 26
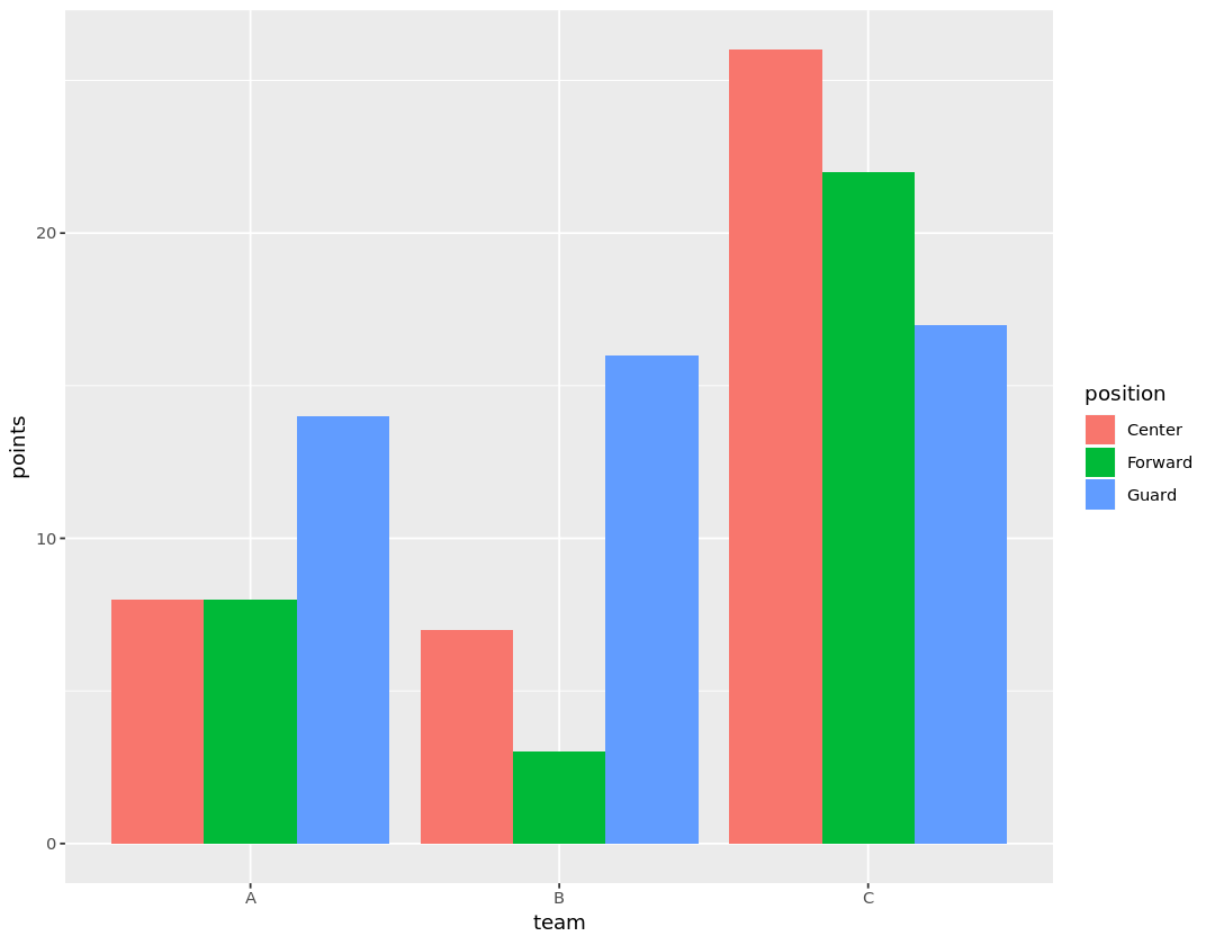
次のコードを使用して、各プレーヤーが獲得したポイントをチームとポジションごとにグループ化して表示するグループ化された棒グラフを作成できます。
 library (ggplot2)

ggplot(df, aes (fill=position, y=points, x=team)) +
  geom_bar(position=' dodge ', stat=' identity ')
グループ化された棒グラフのカスタマイズ
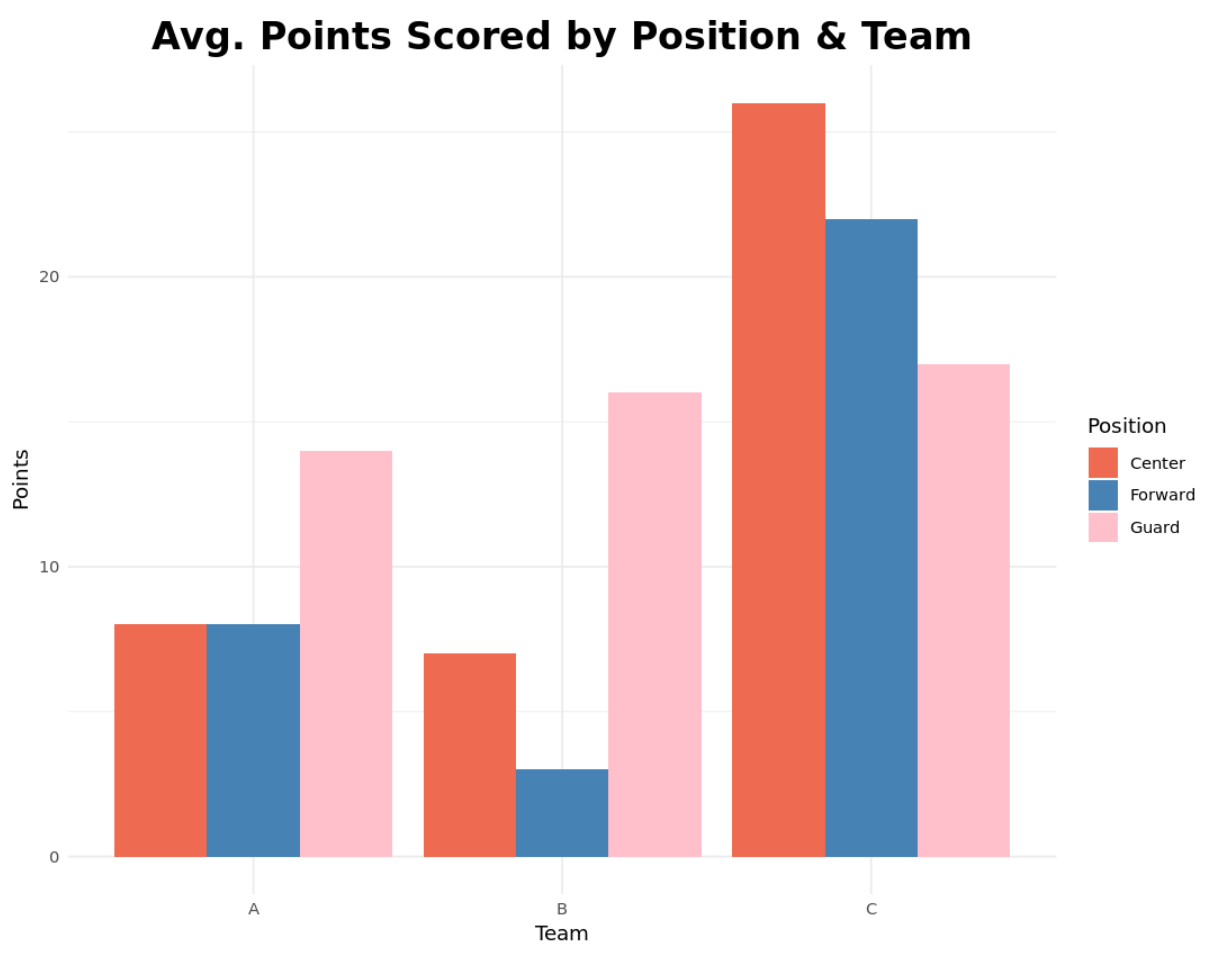
グループ化された棒グラフのタイトル、軸ラベル、テーマ、色をカスタマイズして、希望の外観を与えることもできます。
 library (ggplot2)

ggplot(df, aes (fill=position, y=points, x=team)) +
  geom_bar(position=' dodge ', stat=' identity ') +
  theme_minimal() +
  labs(x=' Team ', y=' Points ', title=' Avg. Points Scored by Position & Team ') +
  theme(plot.title = element_text (hjust=0.5, size=20, face=' bold ')) +
  scale_fill_manual(' Position ', values=c(' coral2 ', ' steelblue ', ' pink '))
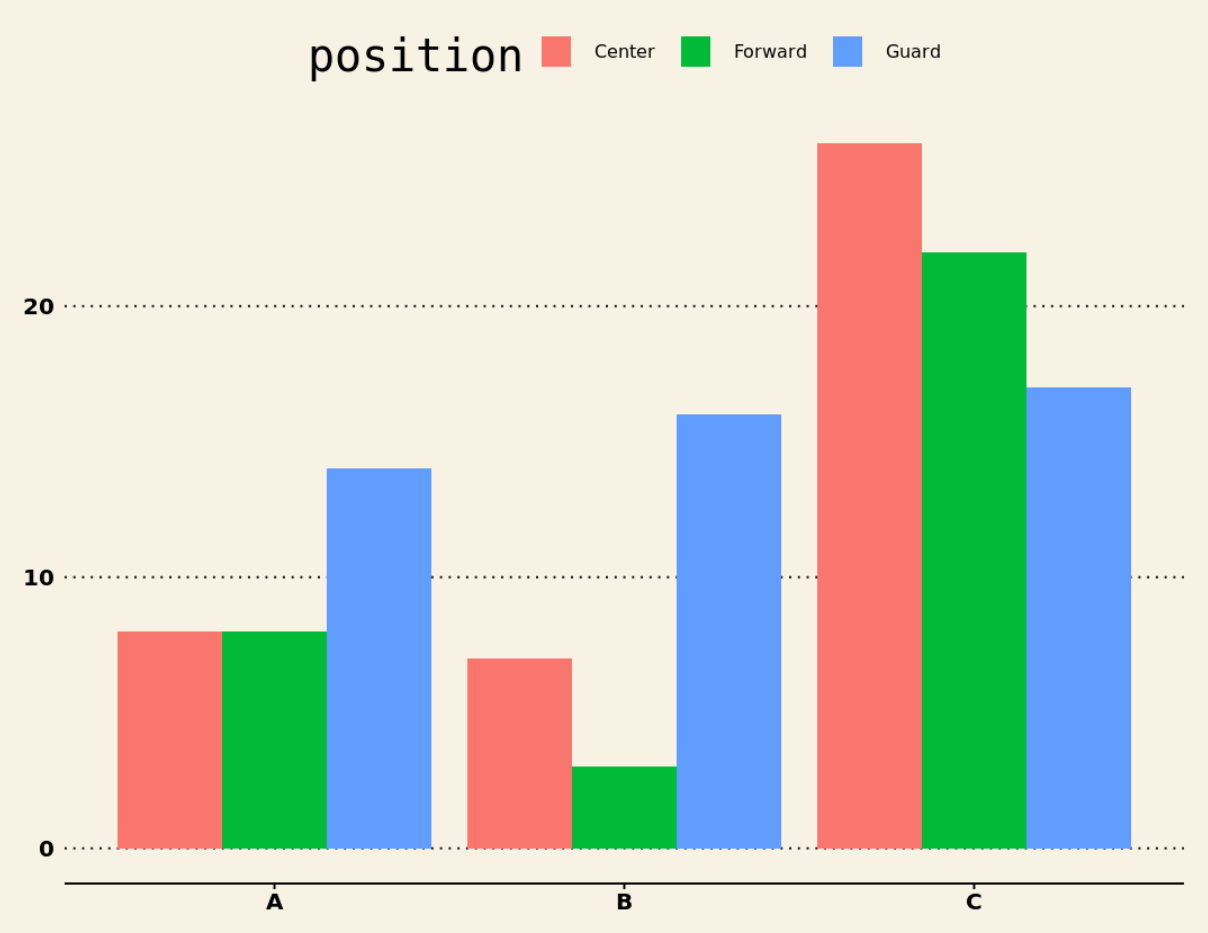
ggthemesライブラリのテーマの 1 つを使用して、外観をさらにカスタマイズできます。たとえば、このライブラリの Wall Street Journal テーマを使用できます。
 install.packages ('ggthemes')

library (ggplot2)
library (ggthemes)

ggplot(df, aes (fill=position, y=points, x=team)) +
  geom_bar(position=' dodge ', stat=' identity ') +
  theme_wsj()
さらに多くのテーマについては、最適な ggplot2 テーマの完全ガイドを参照してください。
追加リソース
R で積み上げ棒グラフを作成する方法
ggplot2 を使用して R でグループ化された箱ひげ図を作成する方法
ggplot2 で並列プロットを作成する方法
著者について
ベンジャミン・アンダーソン博士
私はベンジャミンです。退職した統計教授から、専任の Statorials 教育者になりました。 統計分野における豊富な経験と専門知識を活かして、私は Statorials を通じて学生に力を与えるために自分の知識を共有することに尽力しています。もっと知る