R でフォレスト プロットを作成する方法
フォレスト プロット(「ブロボグラム」とも呼ばれます) は、複数の研究の結果を 1 つのプロットで視覚化するメタ分析で使用されます。

お茶
このタイプのプロットは、複数のスタディの結果を同時に表示する便利な方法を提供します。
次の例は、R でフォレスト プロットを作成する方法を示しています。
例: R の森林プロット
R でフォレスト プロットを作成するには、まず各研究の効果量 (またはその他の関心のある値) と信頼区間の上限と下限を含むデータ フレームを作成する必要があります。
 #create data
df <- data. frame (study=c('S1', 'S2', 'S3', 'S4', 'S5', 'S6', 'S7'),
                 index=1:7,
                 effect=c(-.4, -.25, -.1, .1, .15, .2, .3),
                 lower=c(-.43, -.29, -.17, -.02, .04, .17, .27),
                 upper=c(-.37, -.21, -.03, .22, .24, .23, .33))

#view data
head(df)

  study index effect lower upper
1 S1 1 -0.40 -0.43 -0.37
2 S2 2 -0.25 -0.29 -0.21
3 S3 3 -0.10 -0.17 -0.03
4 S4 4 0.10 -0.02 0.22
5 S5 5 0.15 0.04 0.24
6 S6 6 0.20 0.17 0.23
7 S7 7 0.30 0.27 0.33
次に、ggplot2 データ視覚化パッケージの関数を使用して、次のフォレスト プロットを作成できます。
 #load ggplot2
library (ggplot2)

#create forest plot
ggplot(data=df, aes (y=index, x=effect, xmin=lower, xmax=upper)) +
  geom_point() +
  geom_errorbarh(height= .1 ) +
  scale_y_continuous(name = "", breaks=1: nrow (df), labels=df$study)

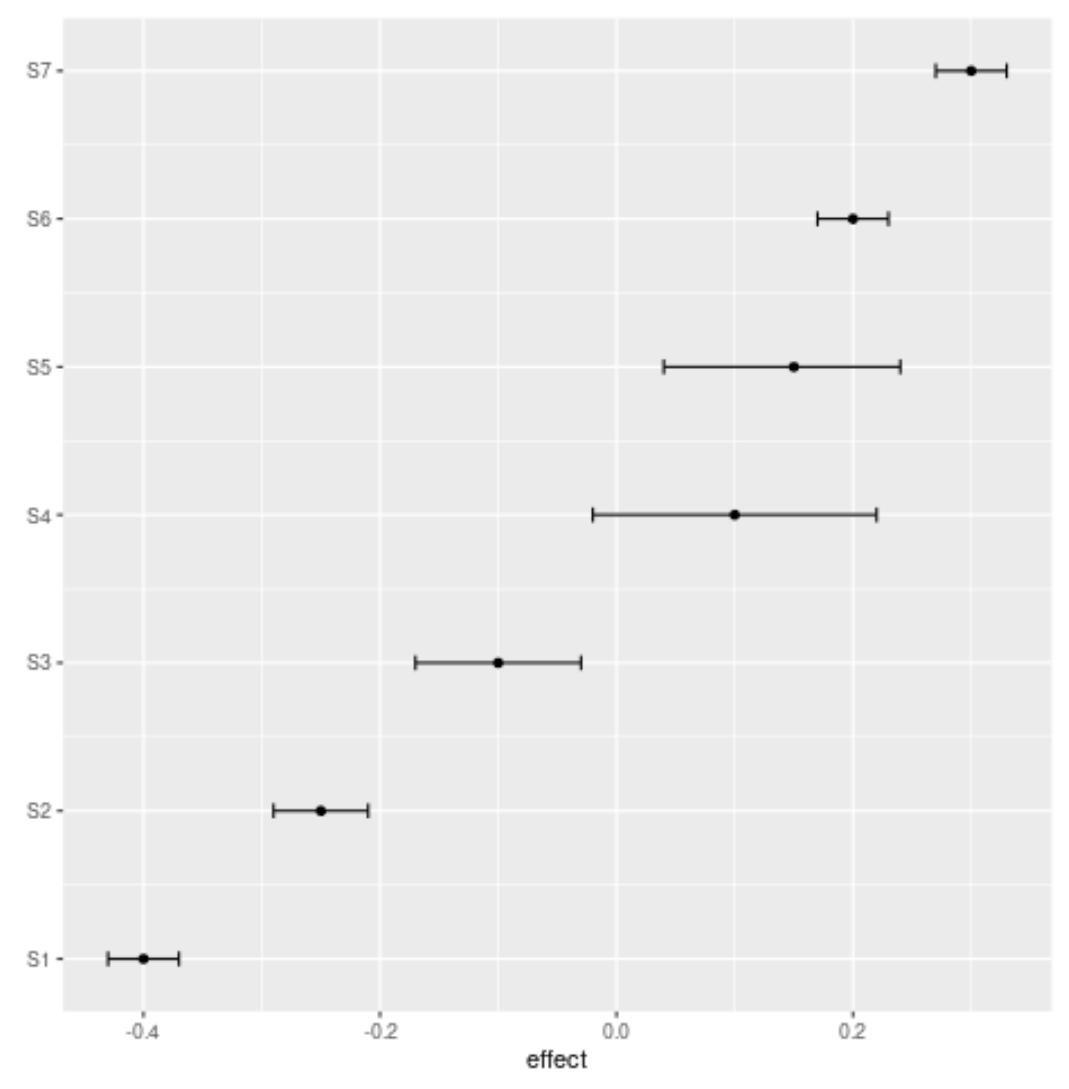
X 軸は各研究の効果量を表示し、Y 軸は各研究の名前を表示します。
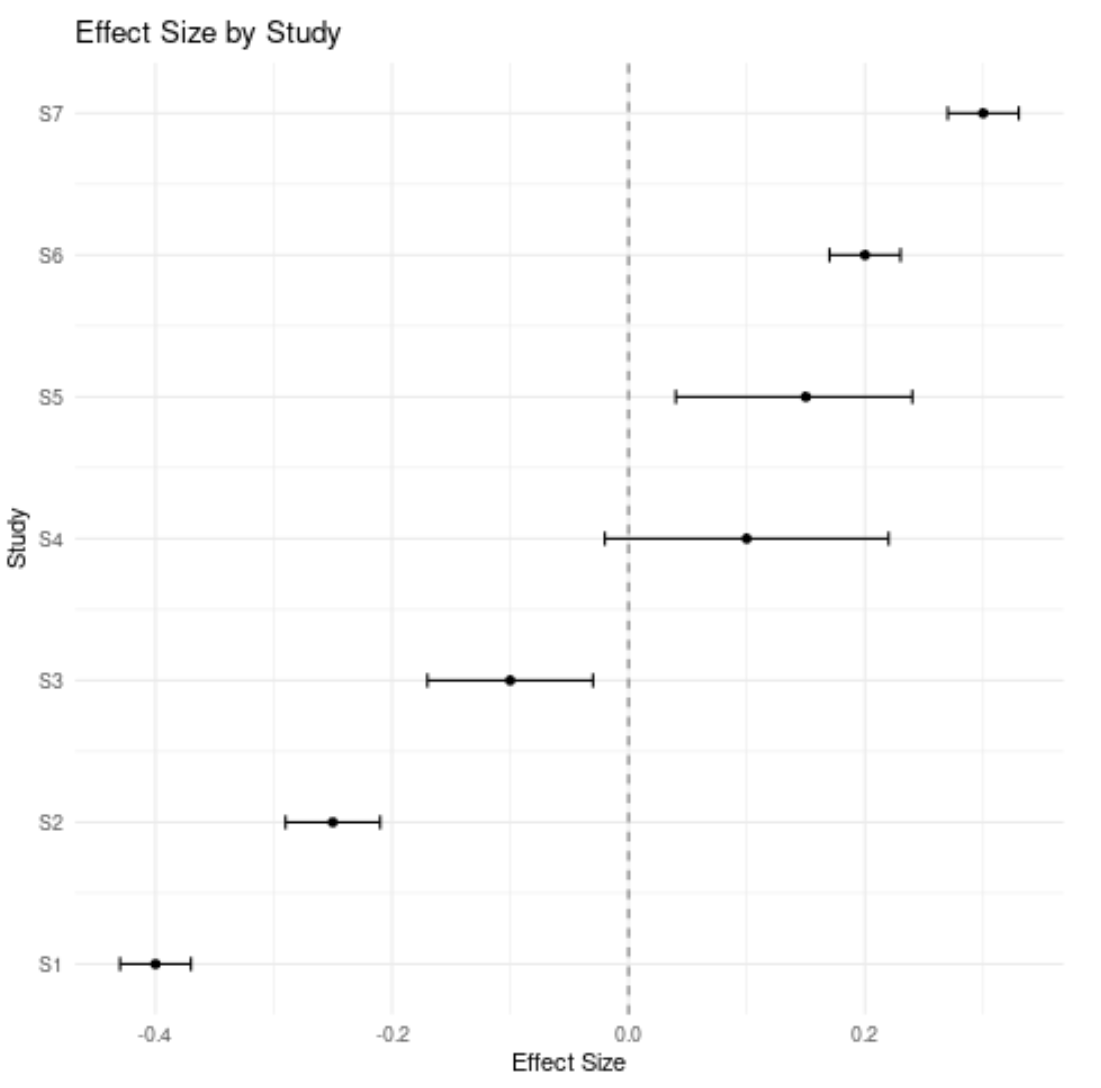
グラフ内の点は各研究の効果量を示し、エラーバーは信頼区間の限界を示します。
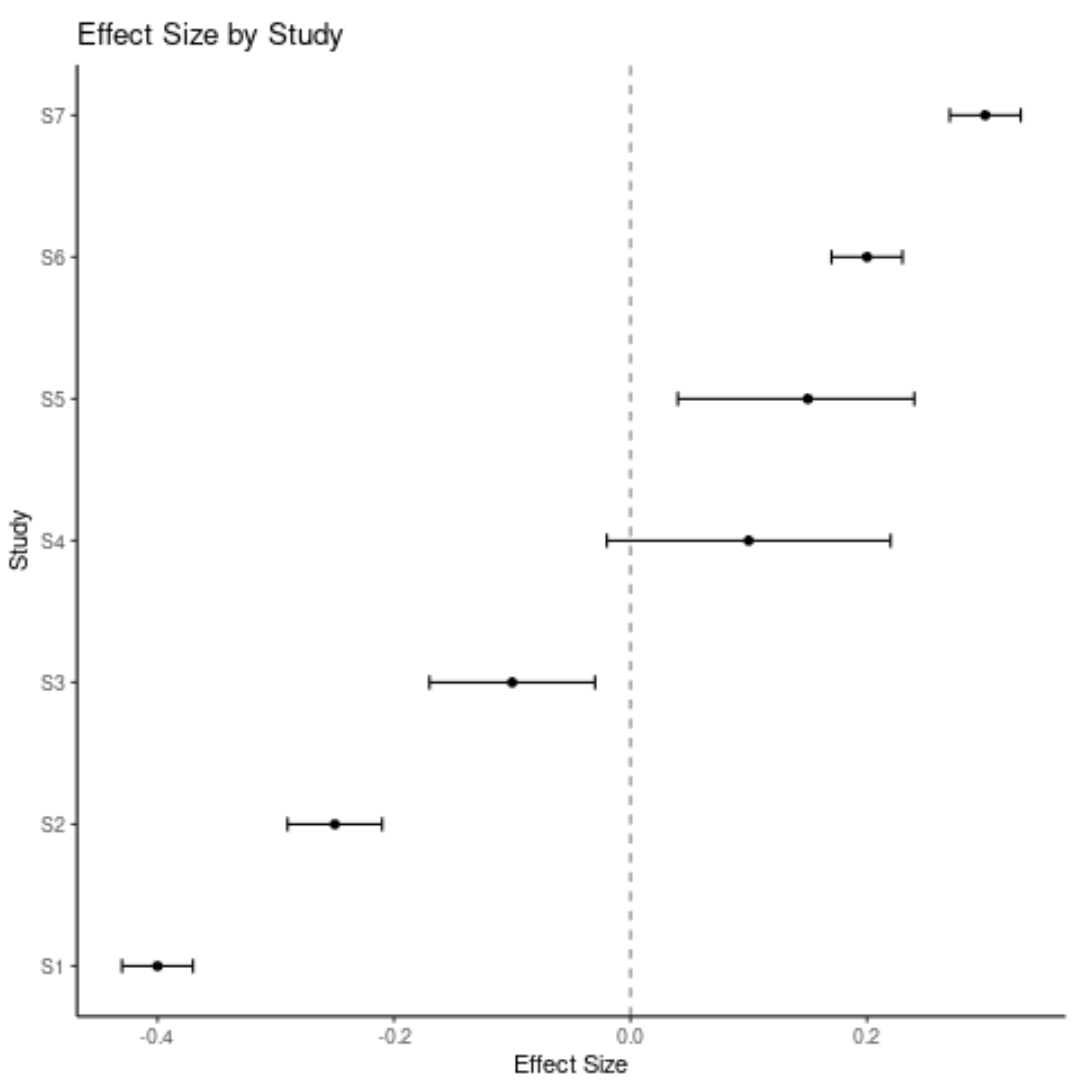
グラフの見栄えを良くするために、タイトルを追加したり、軸ラベルを変更したり、効果サイズ 0 の垂直線を追加したりすることもできることに注意してください。
 #load ggplot2
library (ggplot2)

#create forest plot
ggplot(data=df, aes (y=index, x=effect, xmin=lower, xmax=upper)) +
  geom_point() +
  geom_errorbarh(height= .1 ) +
  scale_y_continuous(breaks=1: nrow (df), labels=df$study) +
  labs(title=' Effect Size by Study ', x=' Effect Size ', y = ' Study ') +
  geom_vline(xintercept=0, color=' black ', linetype=' dashed ', alpha= .5 ) +
  theme_minimal()

プロットのテーマを自由に変更して、好みの見た目にできます。たとえば、さらにクラシックな外観にするために、 theme_classic()を使用することもできます。
 #load ggplot2
library (ggplot2)

#create forest plot
ggplot(data=df, aes (y=index, x=effect, xmin=lower, xmax=upper)) +
  geom_point() +
  geom_errorbarh(height= .1 ) +
  scale_y_continuous(breaks=1: nrow (df), labels=df$study) +
  labs(title=' Effect Size by Study ', x=' Effect Size ', y = ' Study ') +
  geom_vline(xintercept=0, color=' black ', linetype=' dashed ', alpha= .5 ) +
  theme_classic()
