R で並列箱ひげ図を作成する方法 (例付き)
並べた箱ひげ図を使用すると、異なる分布間の類似点と相違点をすばやく視覚化できます。
このチュートリアルでは、次のデータ フレームを使用して、R とggplot2で並列箱ひげ図を作成する方法について説明します。
 #create data frame
df <- data. frame (team=rep(c(' A ', ' B ', ' C '), each= 8 ),
                 points=c(5, 5, 6, 6, 8, 9, 13, 15,
                          11, 11, 12, 14, 15, 19, 22, 24,
                          19, 23, 23, 23, 24, 26, 29, 33))

#view first 10 rows
head(df, 10)

   team points
1 to 5
2 to 5
3 to 6
4 to 6
5 to 8
6 to 9
7 to 13
8 to 15
9 B 11
10 B 11
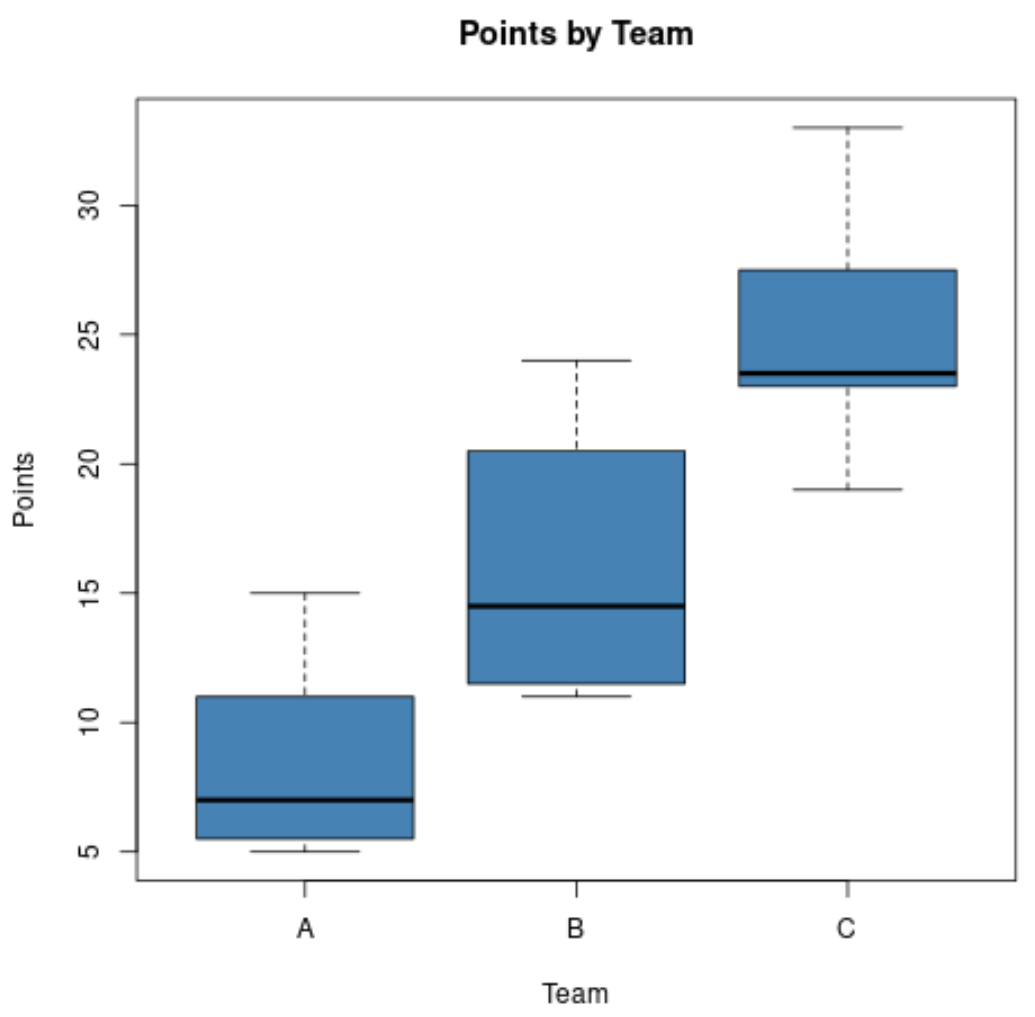
並列 R ベースの箱ひげ図
次のコードは、基数 R で並列箱ひげ図を作成する方法を示しています。
 #create vertical side-by-side boxplots
boxplot(df$points ~ df$team,
        col=' steelblue ',
        main=' Points by Team ',
        xlab=' Team ',
        ylab=' Points ')
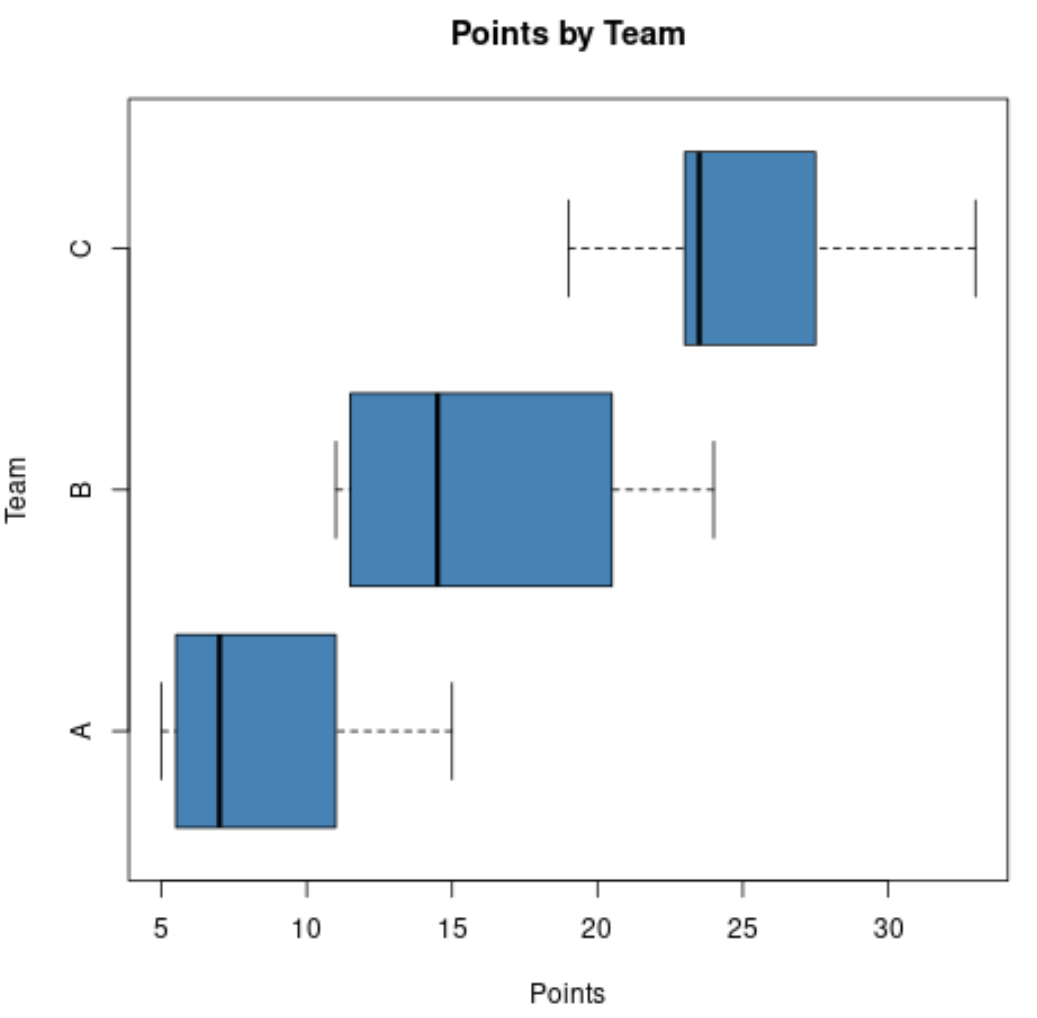
引数horizontal=TRUEを使用すると、箱ひげ図を垂直方向ではなく水平方向に表示できます。
 #create horizontal side-by-side boxplots
boxplot(df$points ~ df$team,
        col=' steelblue ',
        main=' Points by Team ',
        xlab=' Points ',
        ylab=' Team ',
        horizontal= TRUE )
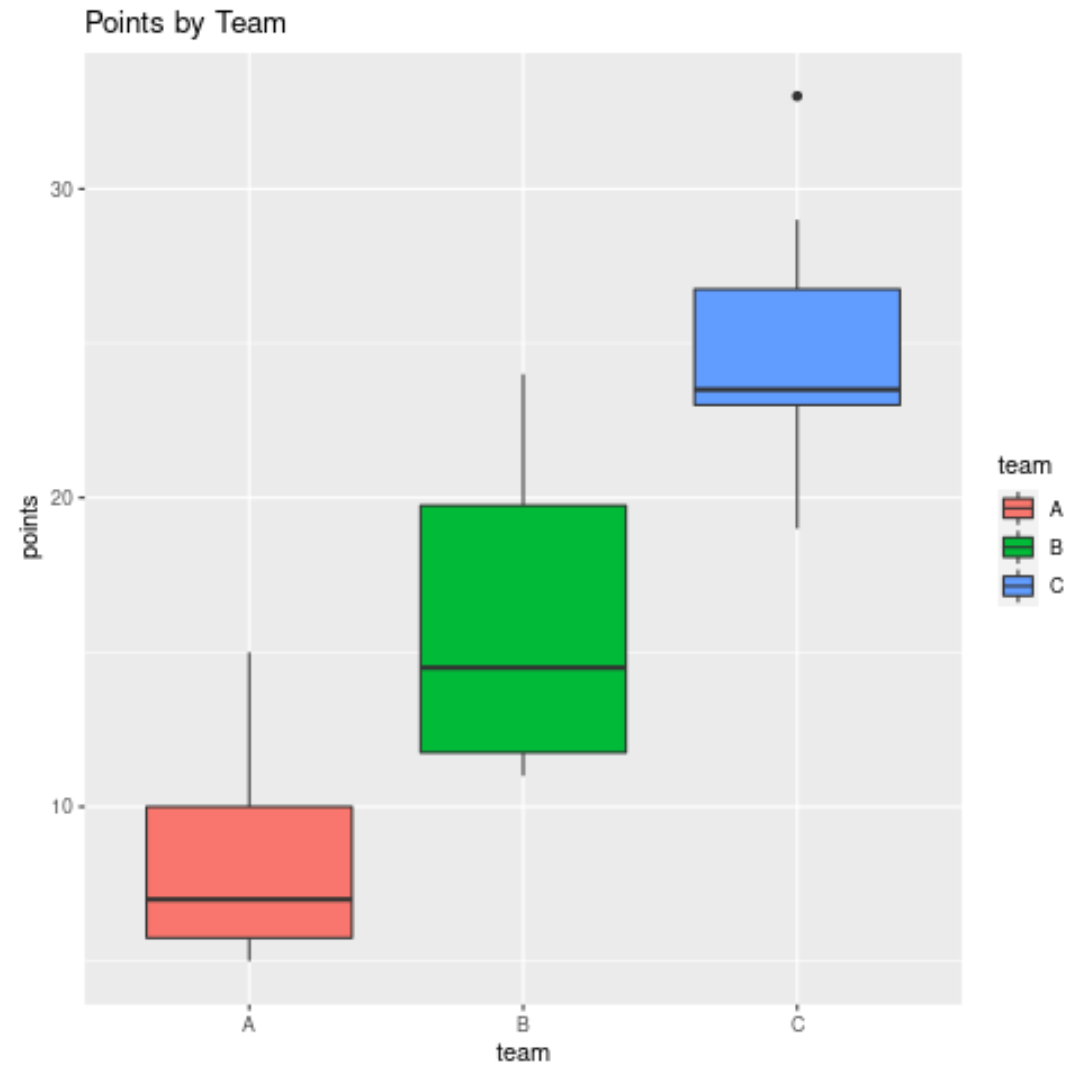
ggplot2 の並列箱ひげ図
次のコードは、ggplot2 で並列垂直箱ひげ図を作成する方法を示しています。
 library (ggplot2)

#create vertical side-by-side boxplots
ggplot(df, aes(x=team, y=points, fill=team)) +
  geom_boxplot() +
  ggtitle(' Points by Team ')
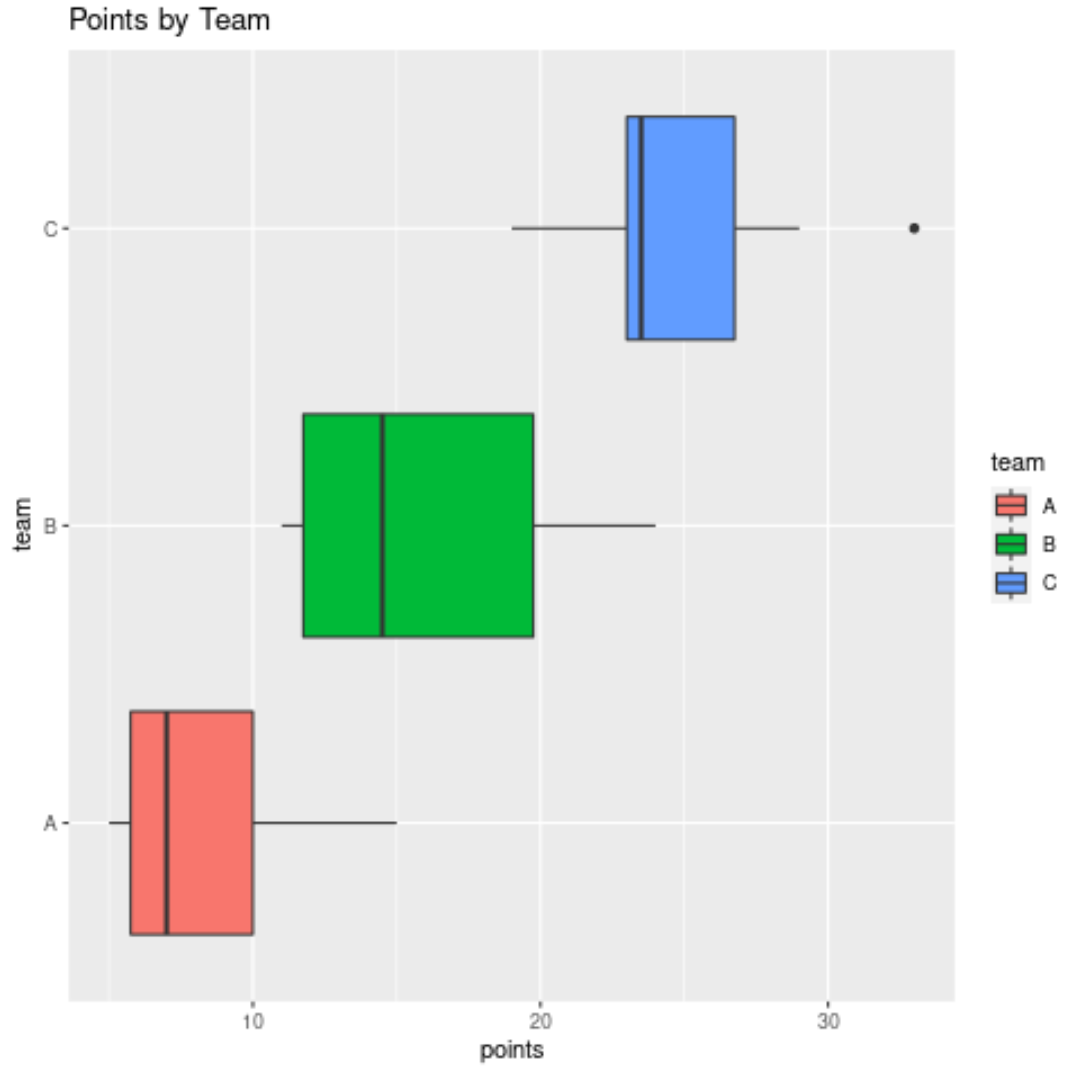
また、 coord_flip()引数を使用すると、箱ひげ図を垂直方向ではなく水平方向に表示できます。
 library (ggplot2)

#create horizontal side-by-side boxplots
ggplot(df, aes(x=team, y=points, fill=team)) +
  geom_boxplot() +
  coordinate_flip() +
  ggtitle(' Points by Team ')
追加リソース
著者について
ベンジャミン・アンダーソン博士
私はベンジャミンです。退職した統計教授から、専任の Statorials 教育者になりました。 統計分野における豊富な経験と専門知識を活かして、私は Statorials を通じて学生に力を与えるために自分の知識を共有することに尽力しています。もっと知る