R で par() 関数を使用する方法
R でpar()関数を使用すると、複数のプロットを一度に作成できます。
この関数は次の基本構文を使用します。
 #define plot area as four rows and two columns
by(mfrow = c(4, 2))

#create plots
plot(1:5)
plot(1:20)
...
次の例は、この関数を実際に使用する方法を示しています。
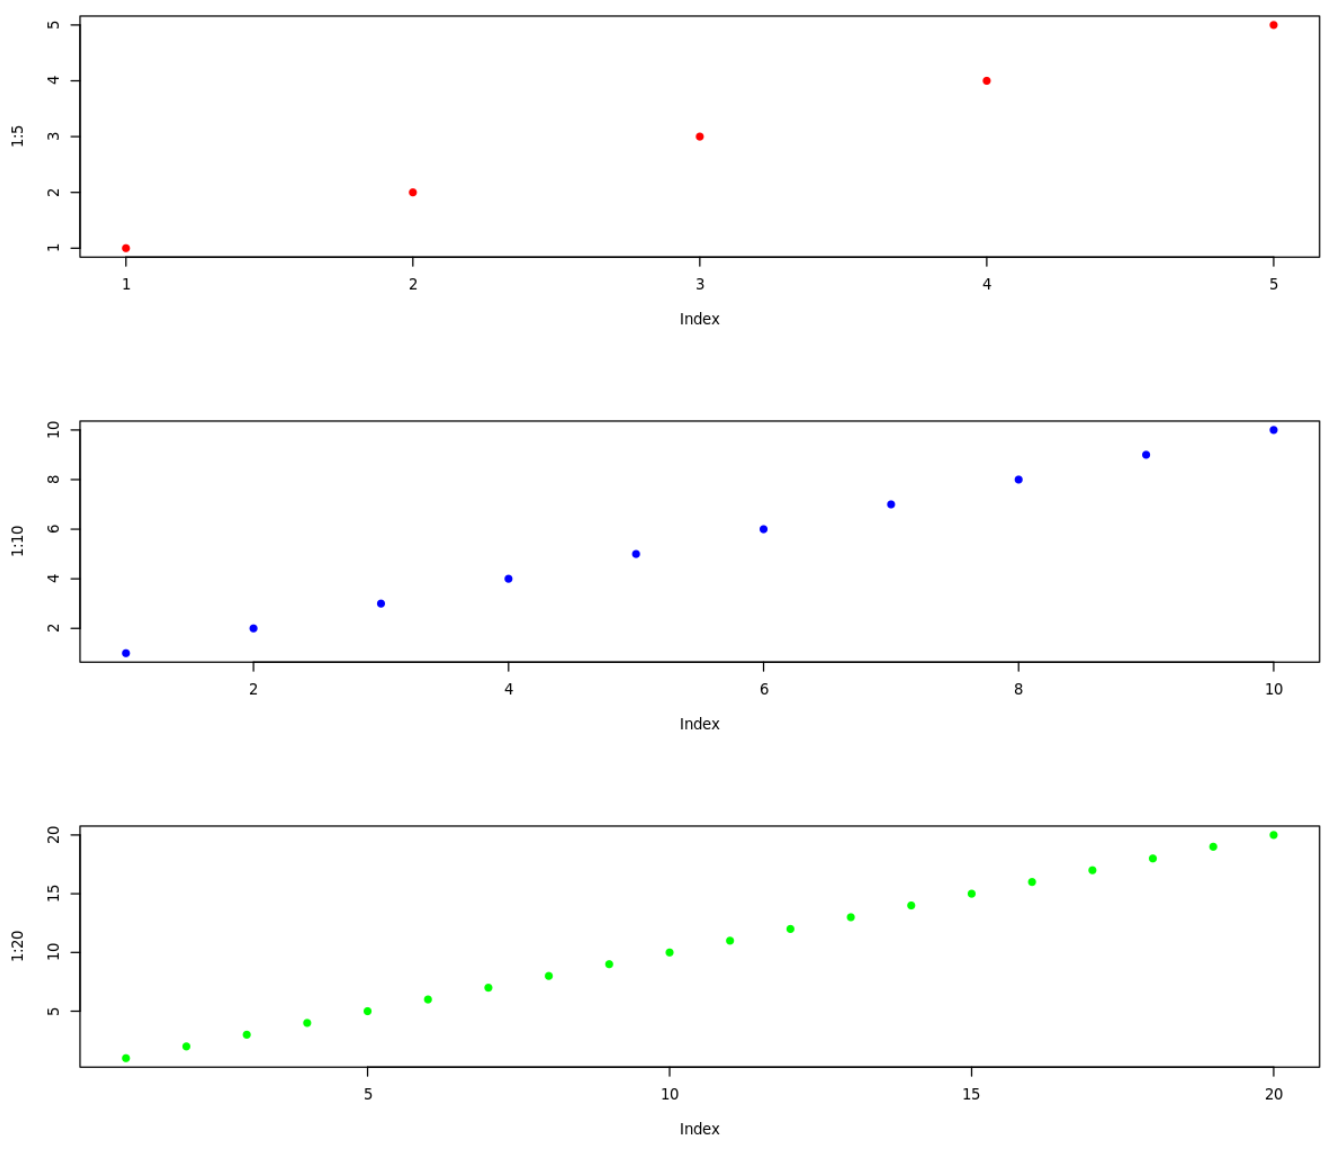
例 1: par() を使用して複数のプロットを表示する
次のコードは、 par()関数を使用して 3 行 1 列のプロット領域を定義する方法を示しています。
 #define plot area as three rows and one column
by(mfrow = c(3, 1))

#create plots
plot(1:5, pch=19, col=' red ')
plot(1:10, pch=19, col=' blue ')
plot(1:20, pch=19, col=' green ')
例 2: mar() を使用してパスのマージンを指定する
次のコードは、 mar()引数を使用して、各パスの周囲のマージンを下、左、上、右の順序で指定する方法を示しています。
注:デフォルトは mar = c(5.1, 4.1, 4.1, 2.1) です。
 #define plot area with tiny bottom margin and huge right margin
par(mfrow = c(3, 1), mar = c(0.5, 4, 4, 20))

#create plots
plot(1:5, pch=19, col=' red ')
plot(1:10, pch=19, col=' blue ')
plot(1:20, pch=19, col=' green ')
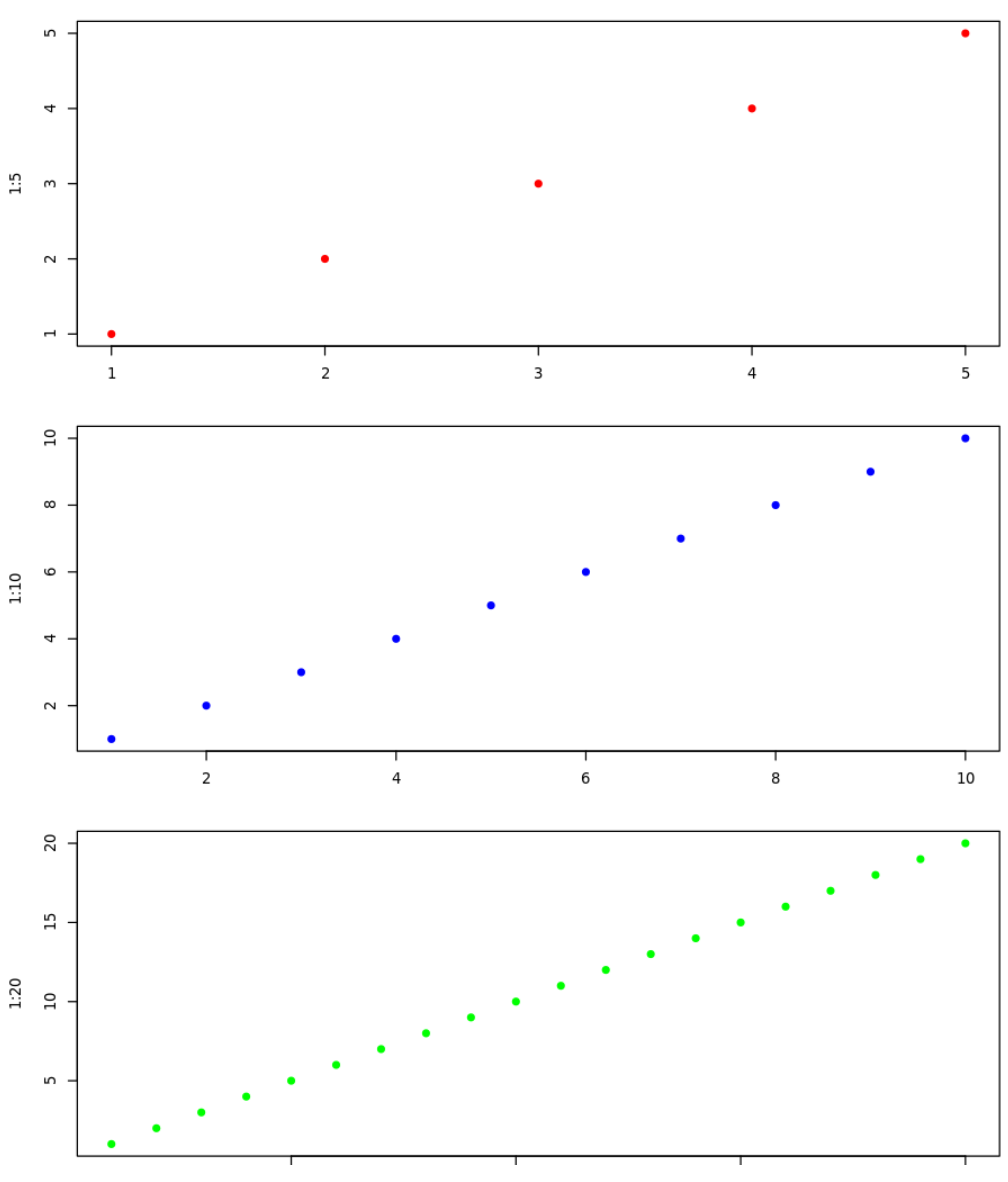
右マージンを大きくしたため、パスが狭く見えることに注目してください。
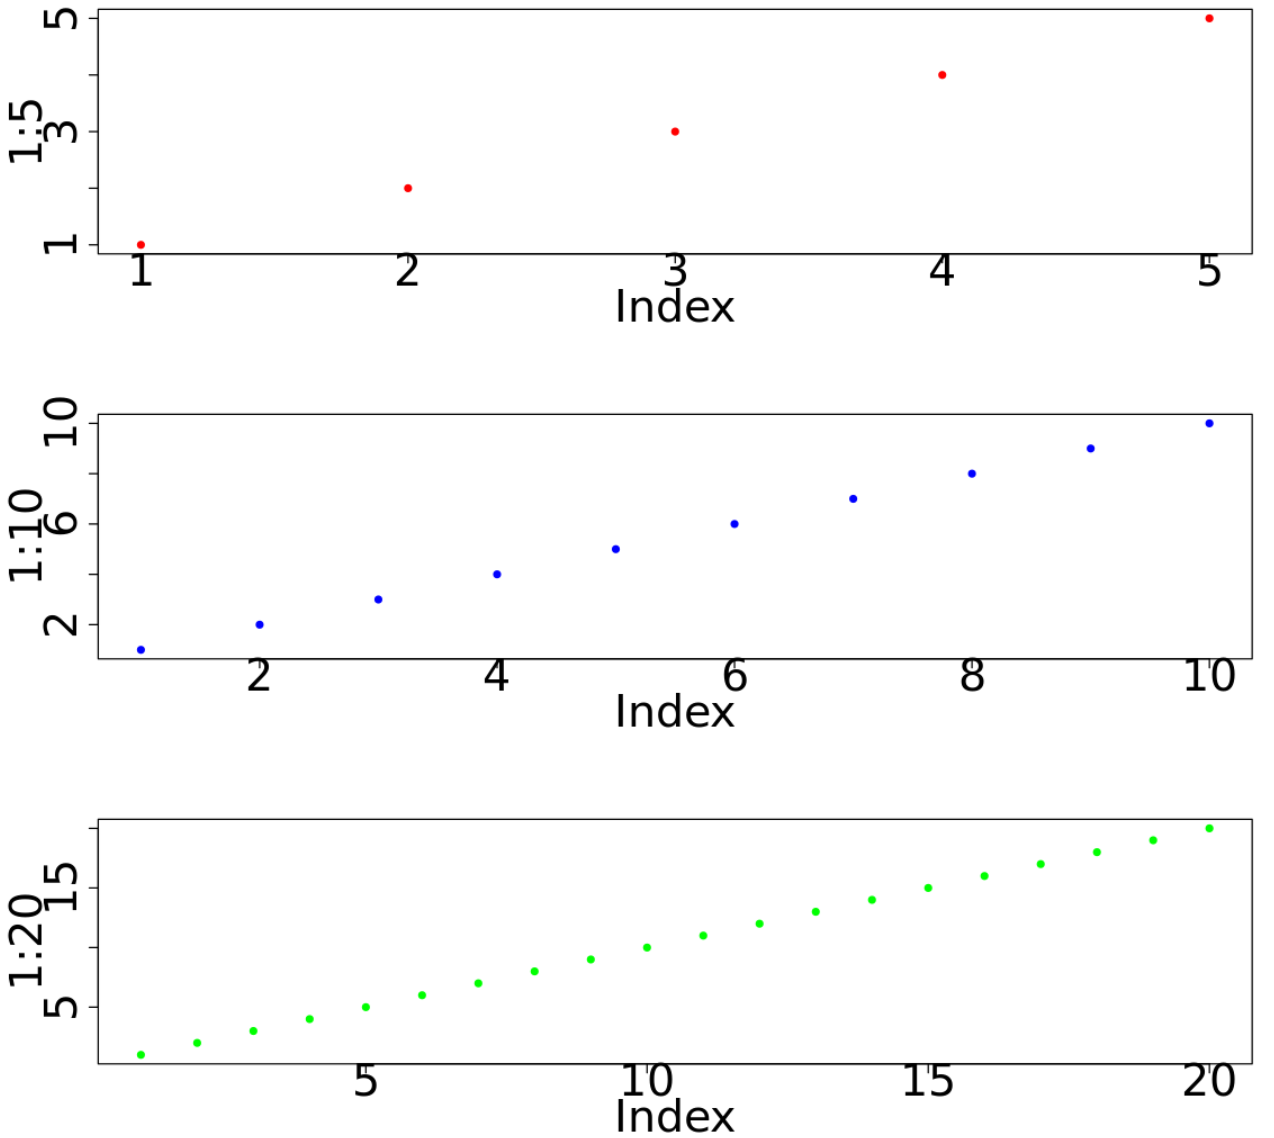
例 3: cex() を使用してプロットのテキスト サイズを指定する
次のコードは、 cex.lab()引数とcex.axis()引数を使用して、それぞれ軸ラベルと目盛りラベルのサイズを指定する方法を示しています。
注:デフォルトは cex.lab = 1 および cex.axis = 1 です。
 #define plot area with large axis labels
par(mfrow = c(3, 1), mar = c(5, 10, 4, 1), cex. axis = 3, cex. lab = 3)

#create plots
plot(1:5, pch=19, col=' red ')
plot(1:10, pch=19, col=' blue ')
plot(1:20, pch=19, col=' green ')
par() 関数の使用が終了したら、 dev.off()関数を使用して par オプションをリセットできます。
 #reset by() options
dev. off ()
par() 関数の使用を終了するたびにdev.off()を使用することをお勧めします。
追加リソース
著者について
ベンジャミン・アンダーソン博士
私はベンジャミンです。退職した統計教授から、専任の Statorials 教育者になりました。 統計分野における豊富な経験と専門知識を活かして、私は Statorials を通じて学生に力を与えるために自分の知識を共有することに尽力しています。もっと知る