Matplotlib で円をプロットする方法 (例付き)
次の構文を使用するCircle()関数を使用すると、Matplotlib のプロットに円を簡単に追加できます。
matplotlib.patches.Circle(xy, radius=5)
金:
- xy:円の座標 (x, y)
- radius:円の半径。デフォルトは 5 です。
このチュートリアルでは、この関数の実際の使用例をいくつか示します。
例 1: 単一の円を作成する
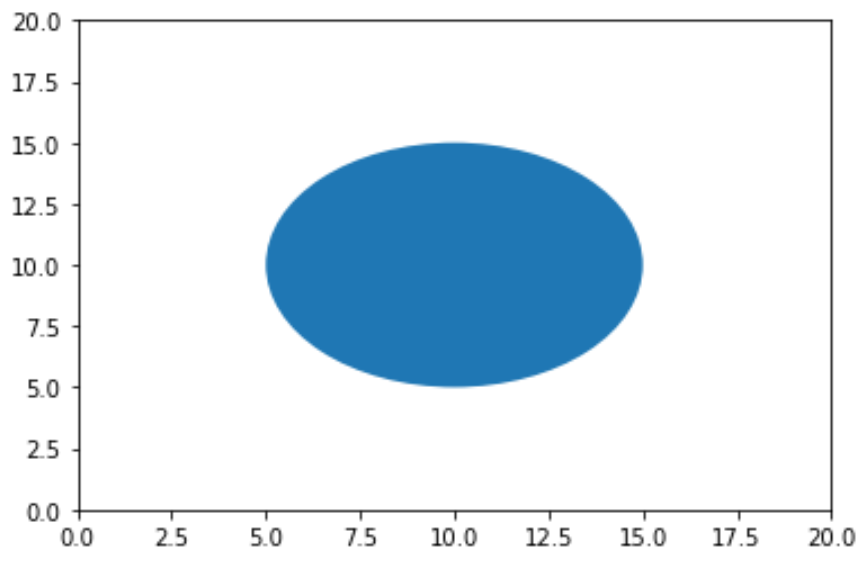
次のコードは、座標 (x,y)(10,10) にある Matplotlib プロット上に単一の円を作成する方法を示しています。
 import matplotlib. pyplot as plt

#set axis limits of plot (x=0 to 20, y=0 to 20)
plt. axis ([0, 20, 0, 20])

#create circle with (x, y) coordinates at (10, 10)
c=plt. Circle ((10, 10))

#add circle to plot (gca means "get current axis")
plt. gca (). add_artist (c)

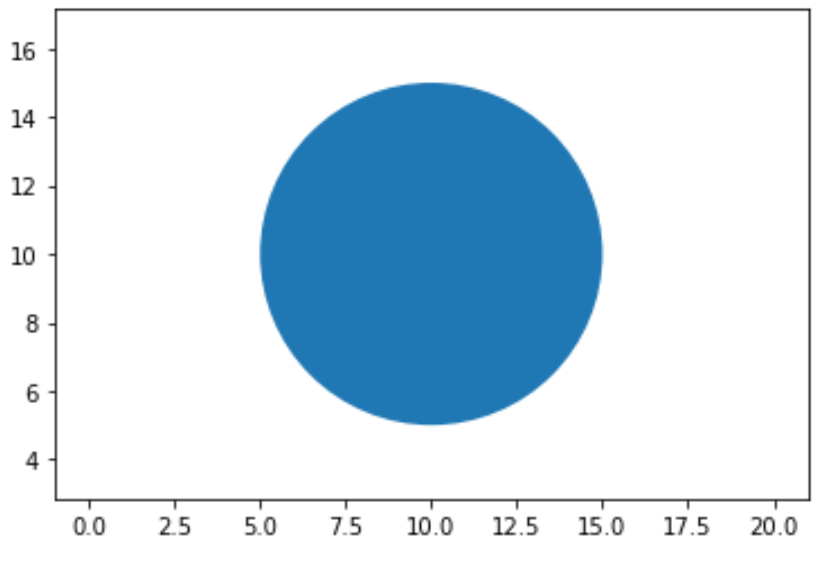
デフォルトでは、Matplotlib プロットの軸には通常、データ単位あたりにより多くのピクセルが表示されます。円を楕円ではなく円として表示するには、次のようにplt.axis(“equal”)引数を使用する必要があります。
 import matplotlib. pyplot as plt

#set axis limits of plot (x=0 to 20, y=0 to 20)
plt. axis ([0, 20, 0, 20])
plt. axis (" equal ")

#create circle with (x, y) coordinates at (10, 10)
c=plt. Circle ((10, 10))

#add circle to plot (gca means "get current axis")
plt. gca (). add_artist (c)

例 2:複数のサークルを作成する
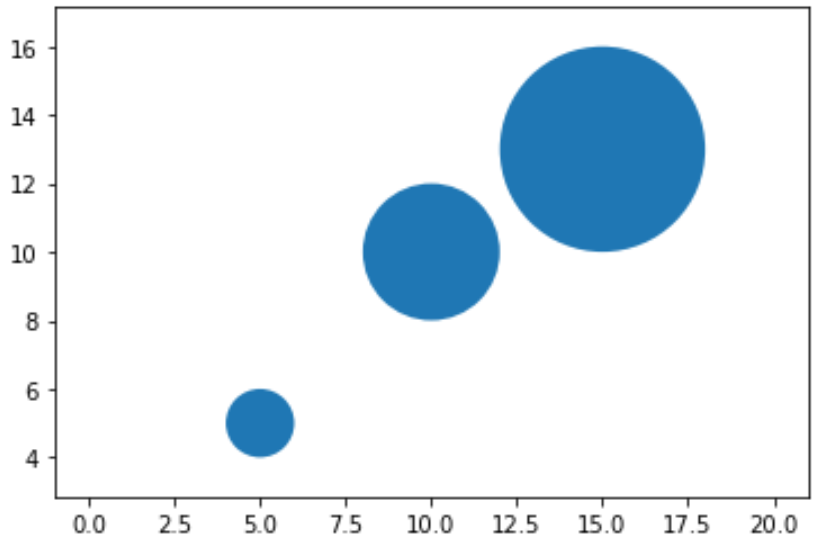
次のコードは、Matplotlib プロット上に複数の円を作成する方法を示しています。
 import matplotlib. pyplot as plt

#set axis limits of plot (x=0 to 20, y=0 to 20)
plt. axis ([0, 20, 0, 20])
plt. axis (" equal ")

#define circles
c1=plt. Circle ((5, 5), radius= 1 )
c2=plt. Circle ((10, 10), radius= 2 )
c3=plt. Circle ((15, 13), radius= 3 )

#add circles to plot
plt. gca (). add_artist (c1)
plt. gca (). add_artist (c2)
plt. gca (). add_artist (c3)

例 3: 円の外観を変更する
次の引数を使用して、Matplotlib の円の外観を変更できます。
- 半径:円の半径を指定します。
- color:円の色を指定します
- alpha:円の透明度を指定します。
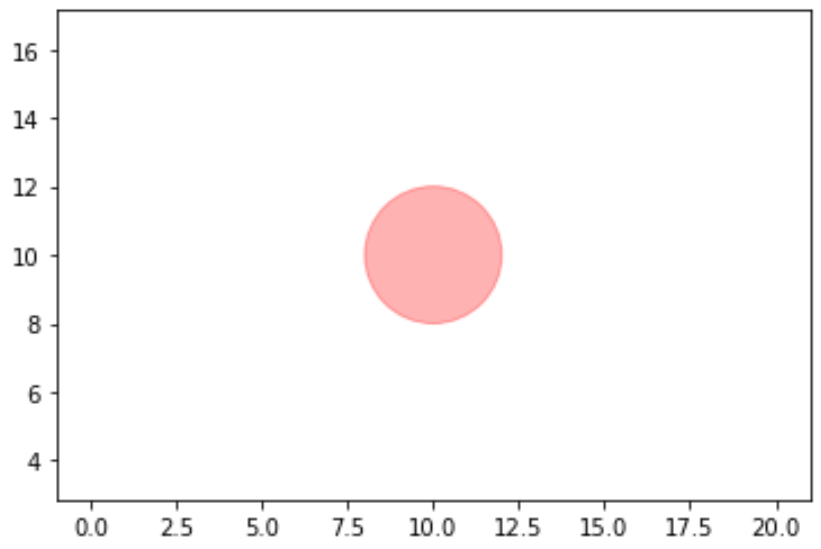
次のコードは、これらの引数の複数を一度に使用する方法の例を示しています。
 import matplotlib. pyplot as plt

#set axis limits of plot (x=0 to 20, y=0 to 20)
plt. axis ([0, 20, 0, 20])
plt. axis (" equal ")

#create circle with (x, y) coordinates at (10, 10)
c=plt. Circle ((10, 10), radius= 2 , color=' red ', alpha= .3 )

#add circle to plot (gca means "get current axis")
plt. gca (). add_artist (c)

カスタムの 16 進カラー コードを使用して円の色を指定することもできることに注意してください。