Ggplot2で凡例のタイトルを削除する方法
次の構文を使用して、ggplot2 のプロットから凡例のタイトルを削除できます。
 ggplot(df, aes(x=x_var, y=y_var, color=group_var)) +
  geom_point() +
  labs(color= NULL )
labs()関数のcolor=NULL引数は、凡例のタイトルを表示しないように ggplot2 に指示します。
次の例は、この構文を実際に使用する方法を示しています。
例: ggplot2 のプロット凡例からタイトルを削除する
R に、さまざまなバスケットボール選手に関する情報を含む次のデータ フレームがあるとします。
 df <- data. frame (assists=c(3, 4, 4, 3, 1, 5, 6, 7, 9),
                 points=c(14, 8, 8, 16, 3, 7, 17, 22, 26),
                 position=rep(c('Guard', 'Forward', 'Center'), times= 3 ))

#view data frame
df

  assist points position
1 3 14 Guard
2 4 8 Forward
3 4 8 Center
4 3 16 Guard
5 1 3 Forward
6 5 7 Center
7 6 17 Guard
8 7 22 Forward
9 9 26 Center
geom_point()を使用して ggplot2 で点群を作成すると、凡例がデフォルトのタイトルで表示されます。
 library (ggplot2)

#create scatter plot of assists vs. points, grouped by position
ggplot(df, aes(x=assists, y=points, color=position)) +
  geom_point(size= 3 )
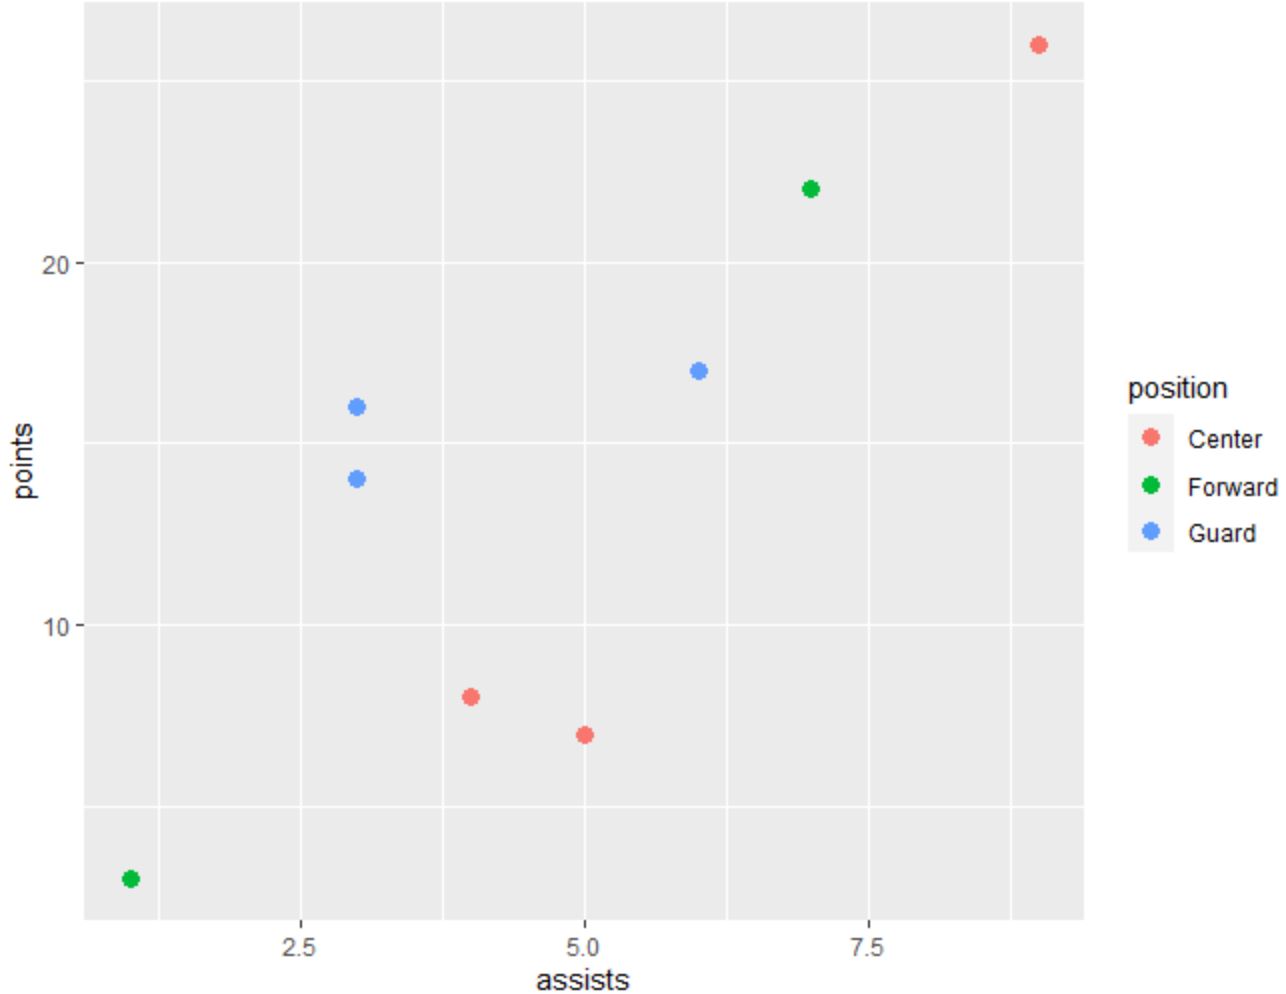
現在、凡例には凡例のタイトルとして「位置」というテキストが表示されていることに注意してください。
このタイトルを凡例から削除するには、 labs(color=NULL)引数を使用します。
 library (ggplot2)

#create scatter plot and remove legend title
ggplot(df, aes(x=assists, y=points, color=position)) +
  geom_point(size= 3 ) +
  labs(color= NULL )
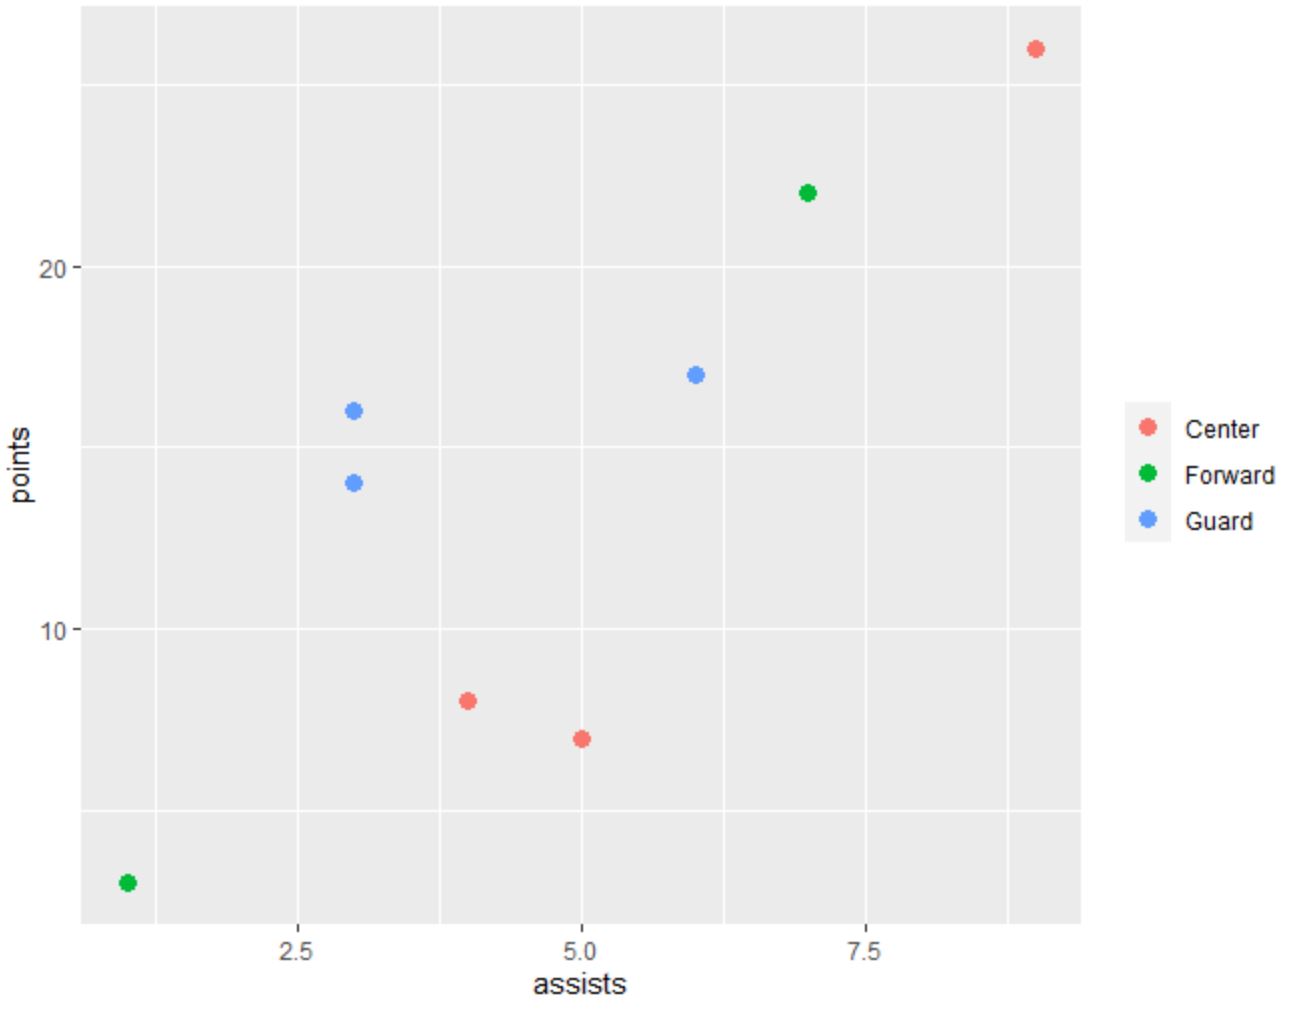
キャプションのタイトルが削除されていることに注意してください。
追加リソース
次のチュートリアルでは、ggplot2 で他の一般的なタスクを実行する方法を説明します。
ggplot2で凡例のタイトルを変更する方法
ggplot2で凡例のサイズを変更する方法
ggplot2で凡例の位置を変更する方法
著者について
ベンジャミン・アンダーソン博士
私はベンジャミンです。退職した統計教授から、専任の Statorials 教育者になりました。 統計分野における豊富な経験と専門知識を活かして、私は Statorials を通じて学生に力を与えるために自分の知識を共有することに尽力しています。もっと知る