Seaborn 棒グラフで棒の幅を変更する方法
width引数を使用して、 Seaborn棒グラフの棒の幅を変更できます。
sns. barplot (x=' xvar ', y=' yvar ', data=df, width= 0.8 )
幅のデフォルト値は0.8です。
幅の値が小さいほど、バーは細くなります。
次の例は、この引数を実際に使用する方法を示しています。
例: Seaborn 棒グラフの棒の幅を変更する
会社のさまざまな従業員による総売上高に関する情報を含む次のパンダ データフレームがあるとします。
 import pandas as pd

#createDataFrame
df = pd. DataFrame ({' employee ': ['Andy', 'Bert', 'Chad', 'Doug', 'Eric', 'Frank'],
                   ' sales ': [22, 14, 9, 7, 29, 20]})

#view DataFrame
print (df)

  employee sales
0 Andy 22
1 Bert 14
2 Chad 9
3 Doug 7
4 Eric 29
5 Frank 20
次の構文を使用して、 widthのデフォルト値0.8を使用して Seaborn で棒グラフを作成できます。
 import seaborn as sns

#create bar plot with default width
sns. barplot (x=' employee ', y=' sales ', data=df). set (title=' Default Width ')
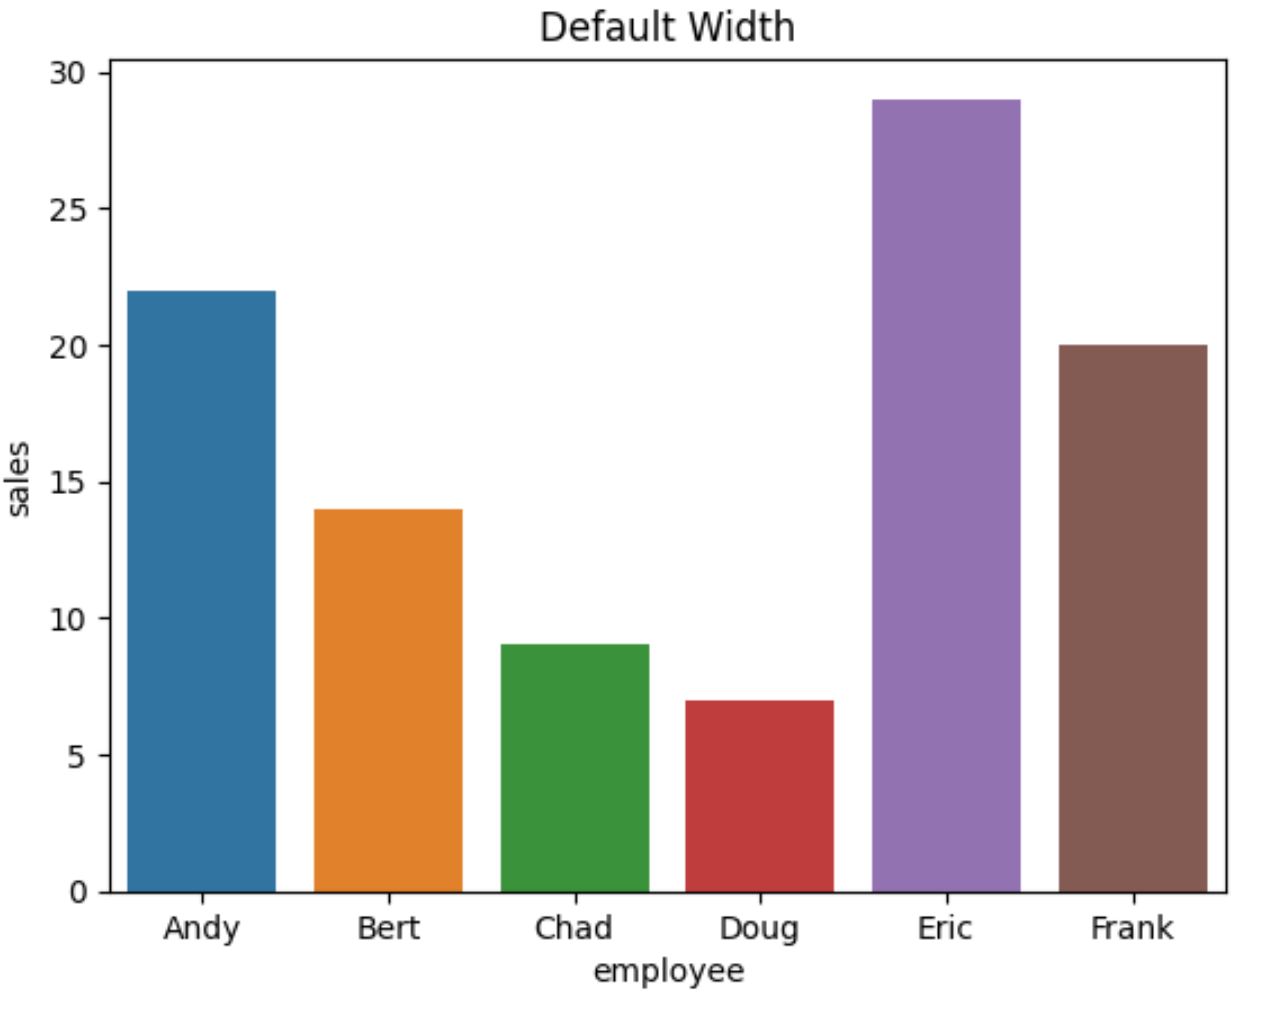
次のコードは、 width引数を0.4に設定して各バーの幅を減らす方法を示しています。
 import seaborn as sns

#create bar plot with width = 0.4
sns. barplot (x=' employee ', y=' sales ', data=df, width= 0.4 ). set (title=' Width = 0.4 ')
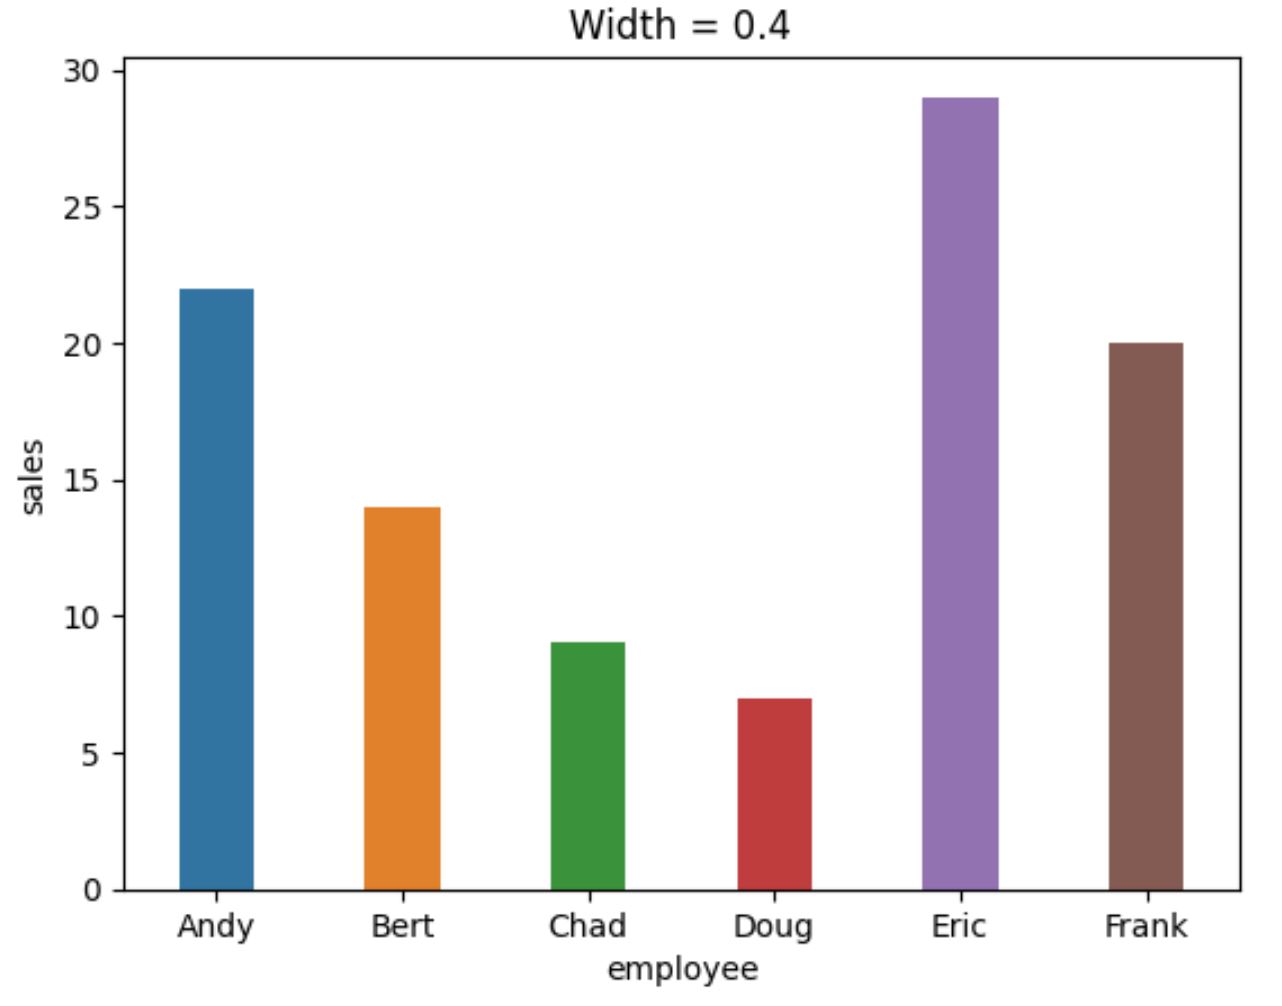
このプロットでは、前のプロットに比べてバーがかなり細いことに注意してください。
各バーを互いに接触させたい場合は、幅を1に設定します。
 import seaborn as sns

#create bar plot with width = 1
sns. barplot (x=' employee ', y=' sales ', data=df, width= 1 ). set (title=' Width = 1 ')
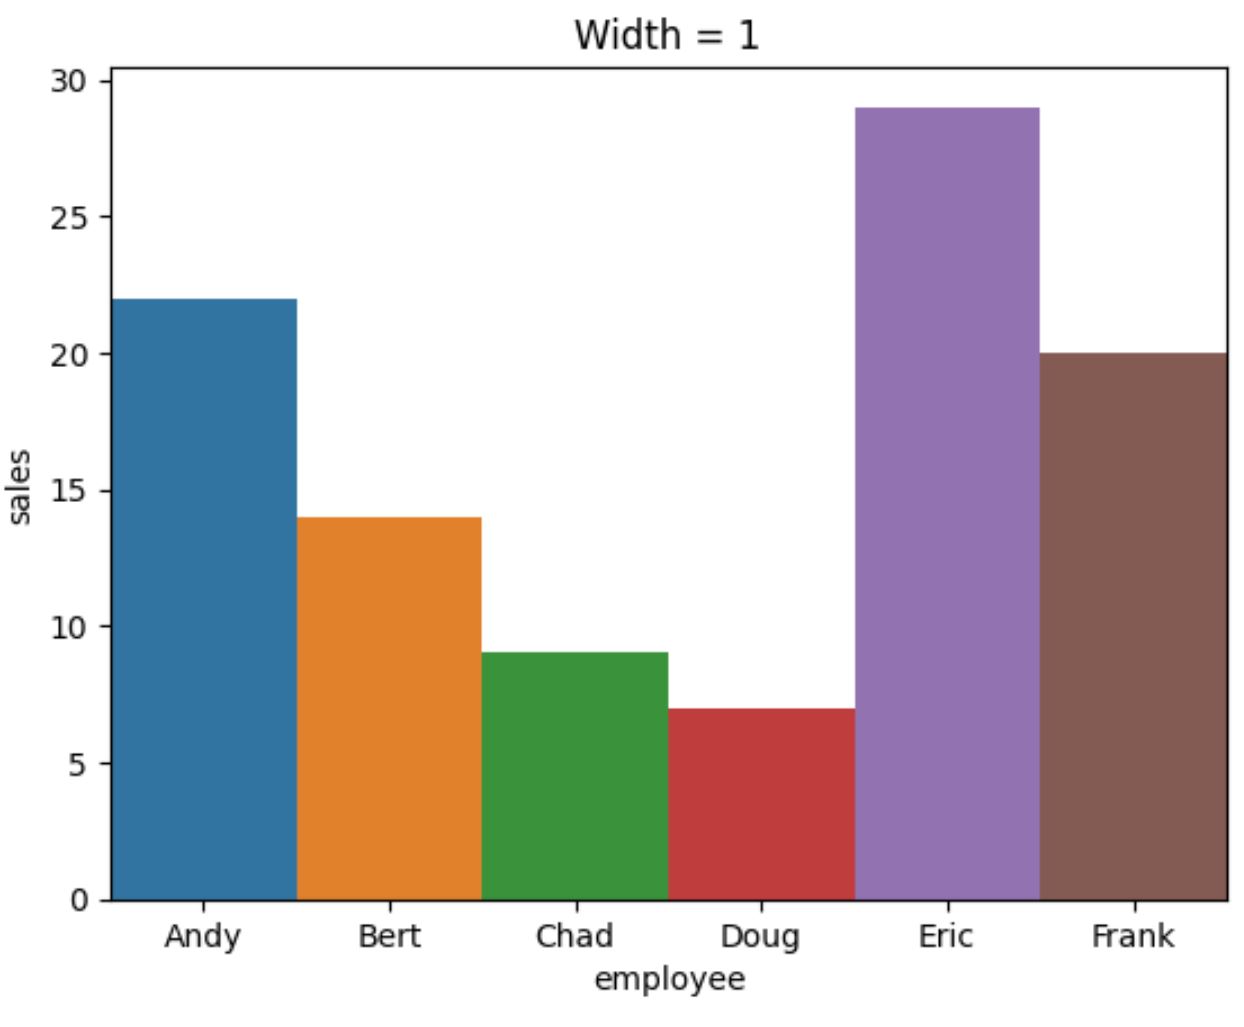
幅を1 より大きい値に設定すると、バーが重なることに注意してください。
注: seaborn のbarplot()関数の完全なドキュメントは 、ここで見つけることができます。
追加リソース
次のチュートリアルでは、seaborn で他の一般的な機能を実行する方法を説明します。
Seaborn Barplotで値を表示する方法
Seaborn でグループ化されたバープロットを作成する方法
Seaborn バープロットのバーの色を設定する方法
著者について
ベンジャミン・アンダーソン博士
私はベンジャミンです。退職した統計教授から、専任の Statorials 教育者になりました。 統計分野における豊富な経験と専門知識を活かして、私は Statorials を通じて学生に力を与えるために自分の知識を共有することに尽力しています。もっと知る