ヒストグラムの図のサイズを変更する方法 pandas
figsize引数を使用して、pandas で作成されたヒストグラムの図のサイズを変更できます。
 import matplotlib. pyplot as plt

#specify figure size (width, height)
fig = plt. figure (figsize=(8,3))
ax = fig. gca ()

#create histogram using specified figure size
df[' my_column ']. hist (ax=ax)
次の例は、実際にfigsize引数を使用する方法を示しています。
例: パンダのヒストグラム図のサイズを変更する方法
次のパンダ データフレームがあるとします。
 import pandas as pd

#createDataFrame
df = pd. DataFrame ({' player ': ['A', 'B', 'C', 'D', 'E', 'F', 'G', 'H',
                              'I', 'J', 'K', 'L', 'M', 'N', 'O', 'P'],
                   ' points ': [10, 12, 14, 15, 15, 15, 16, 17,
                              19, 19, 24, 24, 28, 30, 34, 34]})

#view first five rows of DataFrame
print ( df.head ())

  player points
0 to 10
1 B 12
2 C 14
3 D 15
4 E 15
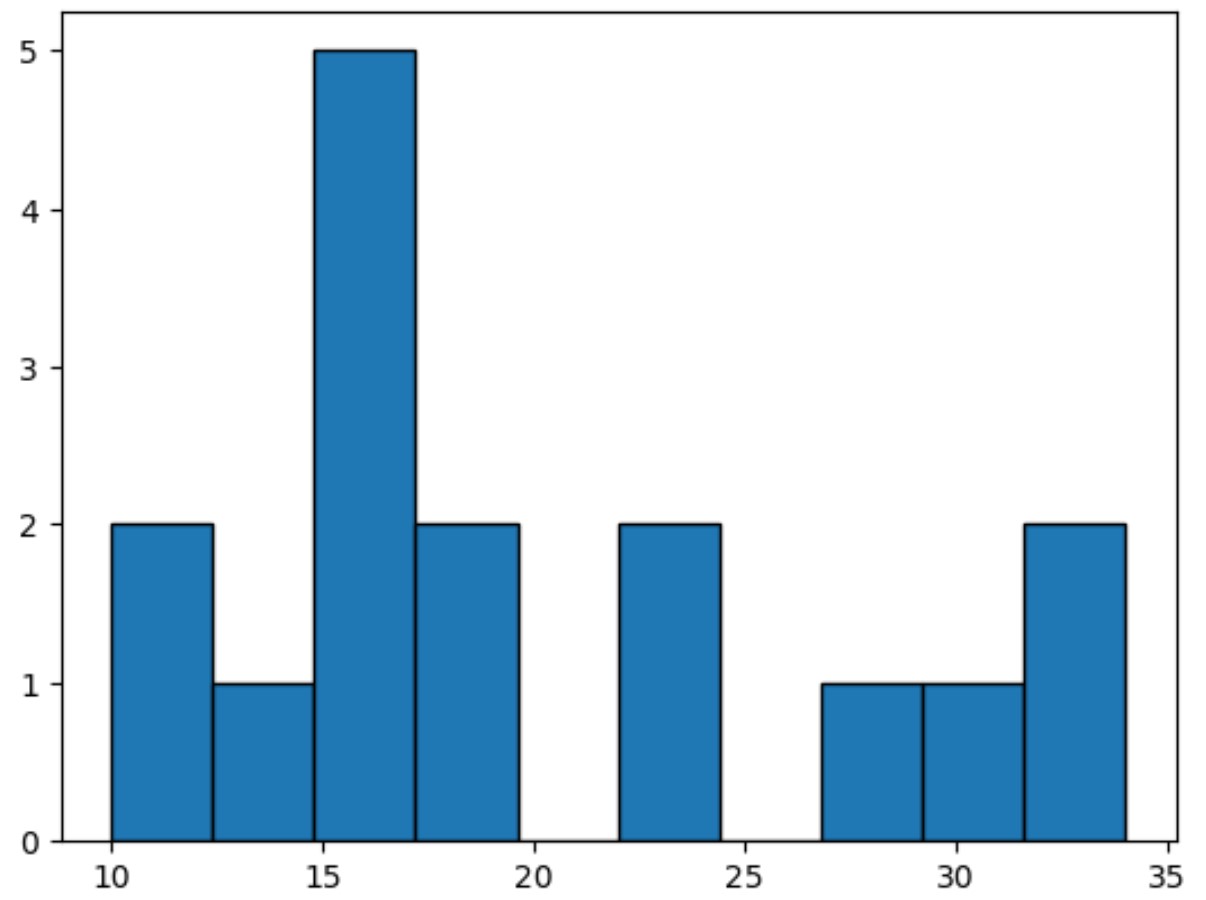
Points 変数のヒストグラムを作成すると、パンダは図の幅として6.4 、高さとして4.8を自動的に使用します。
 import matplotlib. pyplot as plt

#create histogram for variable points
df[' points ']. hist (grid= False ,edgecolor=' black ')
ただし、引数figsizeを使用して、Figure の幅と高さを変更できます。
 import matplotlib. pyplot as plt

#specify figure size (width, height)
fig = plt. figure (figsize=(8,3))
ax = fig. gca ()

#create histogram using specified figure size
df[' points ']. hist ( grid= False , edgecolor=' black ', ax=ax)
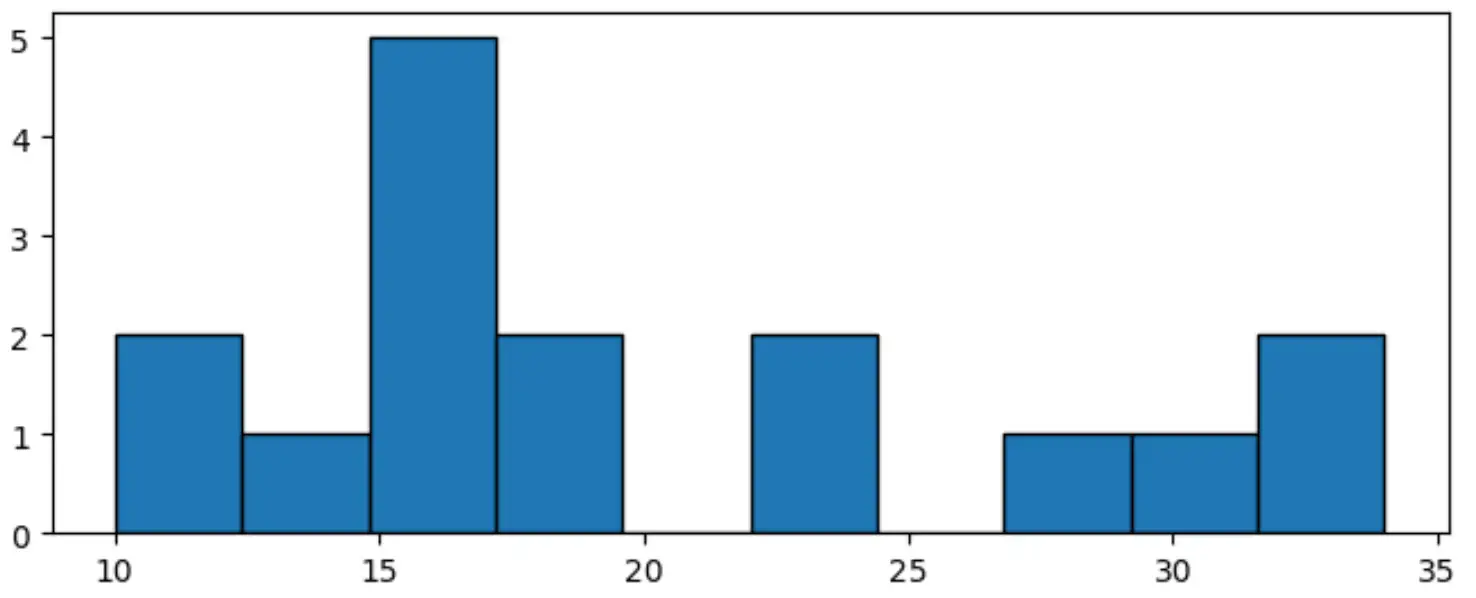
この特定のヒストグラムの幅は8 、高さは3です。
figsize引数を使用して、高さが幅よりも大きい Figure を作成することもできます。
 import matplotlib. pyplot as plt

#specify figure size (width, height)
fig = plt. figure (figsize=(4,7))
ax = fig. gca ()

#create histogram using specified figure size
df[' points ']. hist ( grid= False , edgecolor=' black ', ax=ax)
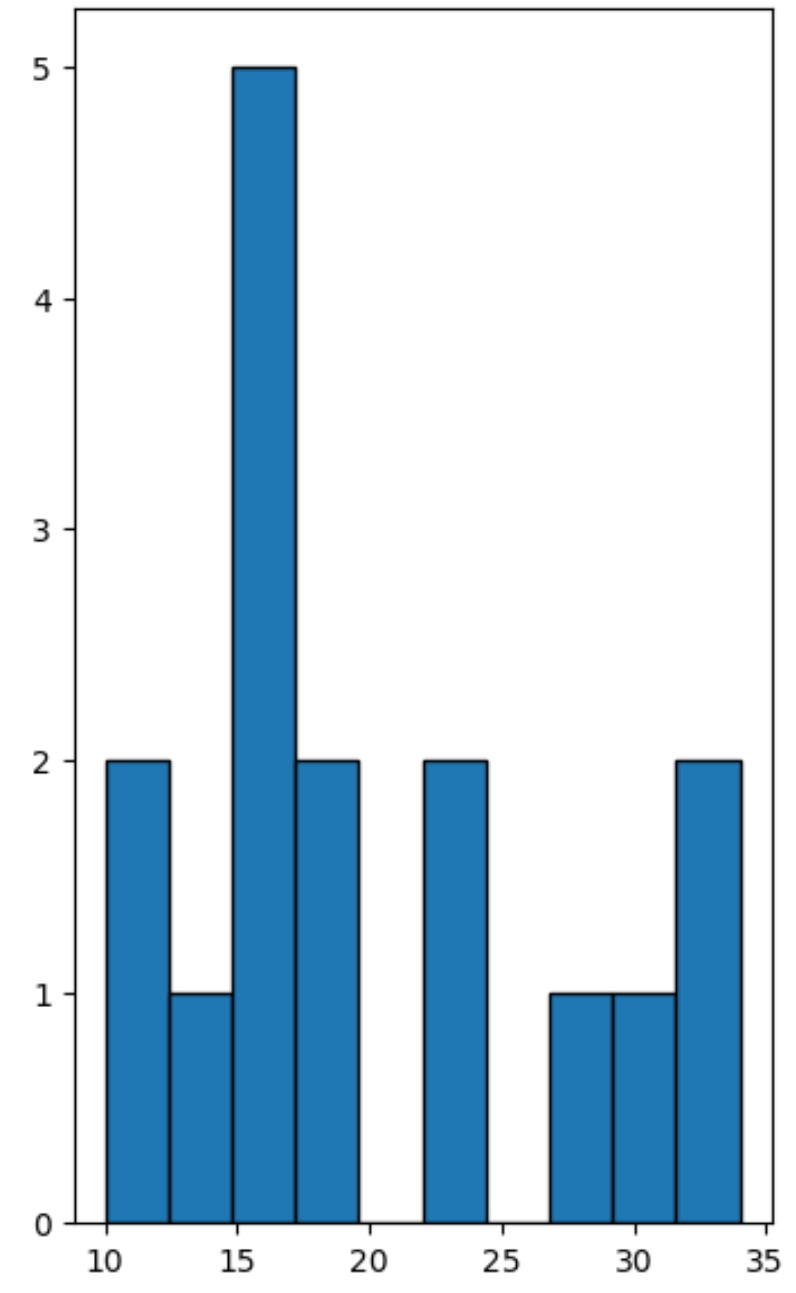
この特定のヒストグラムの幅は4 、高さは7です。
figsize引数の値を自由にいじって、必要な正確なサイズのヒストグラムを作成してください。
追加リソース
次のチュートリアルでは、パンダで他の一般的なタスクを実行する方法を説明します。
Pandas DataFrame からヒストグラムを作成する方法
Pandas シリーズからヒストグラムを作成する方法
Pandas でグループごとにヒストグラムをプロットする方法
著者について
ベンジャミン・アンダーソン博士
私はベンジャミンです。退職した統計教授から、専任の Statorials 教育者になりました。 統計分野における豊富な経験と専門知識を活かして、私は Statorials を通じて学生に力を与えるために自分の知識を共有することに尽力しています。もっと知る