Pandasヒストグラムのy軸にパーセンテージを表示する方法
次の基本構文を使用して、pandas ヒストグラムの y 軸にパーセンテージを表示できます。
 import pandas as pd
import numpy as np
import matplotlib. pyplot as plt
from matplotlib. ticker import PercentFormatter

#create histogram, using percentages instead of counts
plt. hist (df[' my_column '], weights= np.ones ( len (df)) / len (df))

#apply percentage format to y-axis
plt. gca (). yaxis . set_major_formatter (PercentFormatter(1))
plt. show ()
次の例は、この構文を実際に使用する方法を示しています。
例: Pandas ヒストグラムの Y 軸にパーセンテージを表示
さまざまなバスケットボール選手に関する情報を含む次のパンダ データフレームがあるとします。
 import pandas as pd
import numpy as np

#make this example reproducible
n.p. random . seeds (1)

#createDataFrame
df = pd. DataFrame ({' points ': np. random . normal (loc=20, scale=2, size=300),
                   ' assists ': np. random . normal (loc=14, scale=3, size=300),
                   ' rebounds ': np. random . normal (loc=12, scale=1, size=300)})

#view head of DataFrame
print ( df.head ())

      points assists rebounds
0 23.248691 20.197350 10.927036
1 18.776487 9.586529 12.495159
2 18.943656 11.509484 11.047938
3 17.854063 11.358267 11.481854
4 21.730815 13.162707 10.538596
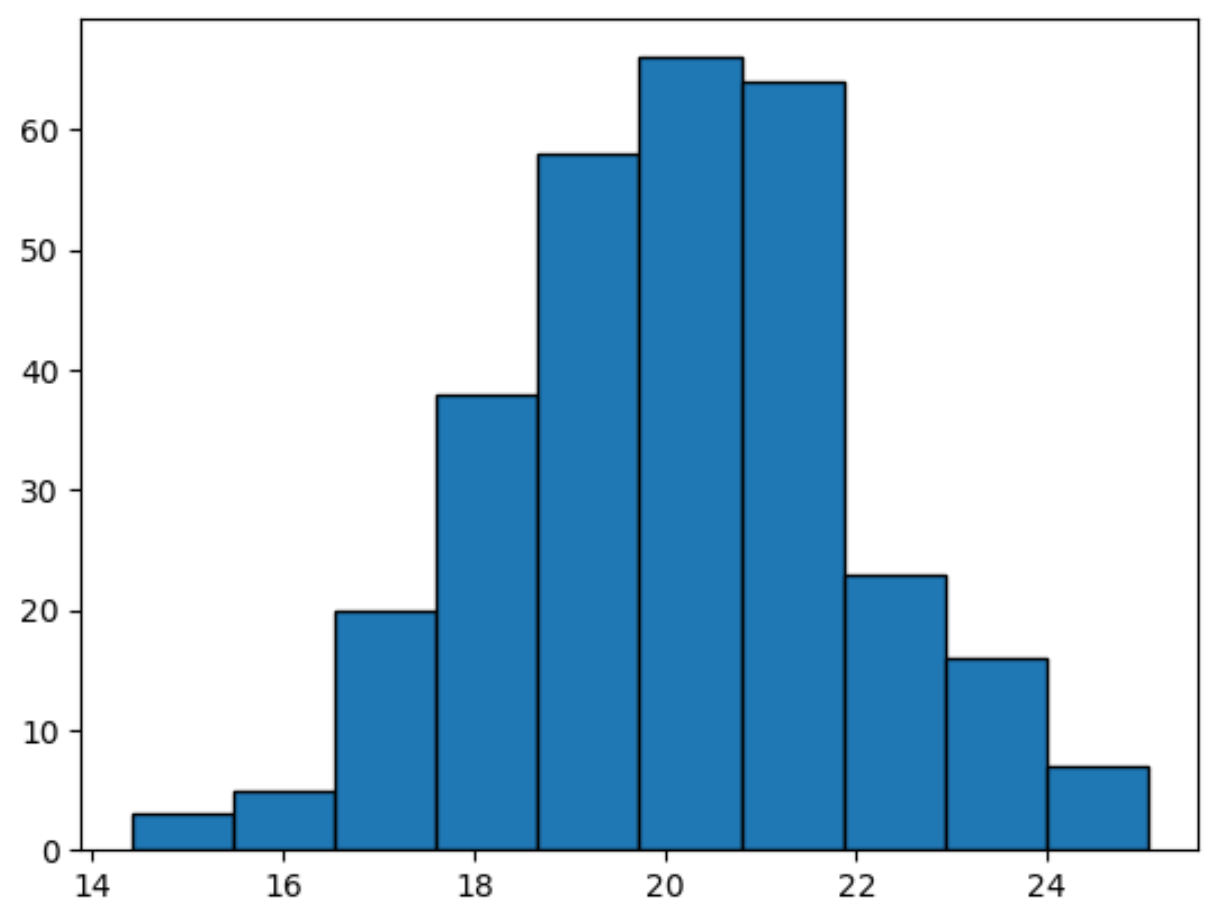
ヒストグラムを作成してポイント列の値の分布を視覚化すると、デフォルトで Y 軸にカウントが表示されます。
 import matplotlib. pyplot as plt

#create histogram for points columb
plt. hist (df[' points '], edgecolor=' black ')
代わりに Y 軸にパーセンテージを表示するには、 PercentFormatter関数を使用できます。
 import numpy as np
import matplotlib. pyplot as plt
from matplotlib. ticker import PercentFormatter

#create histogram, using percentages instead of counts
plt. hist (df[' points '], weights=np. ones ( len (df)) / len (df), edgecolor=' black ')

#apply percentage format to y-axis
plt. gca (). yaxis . set_major_formatter (PercentFormatter(1))
plt. show ()
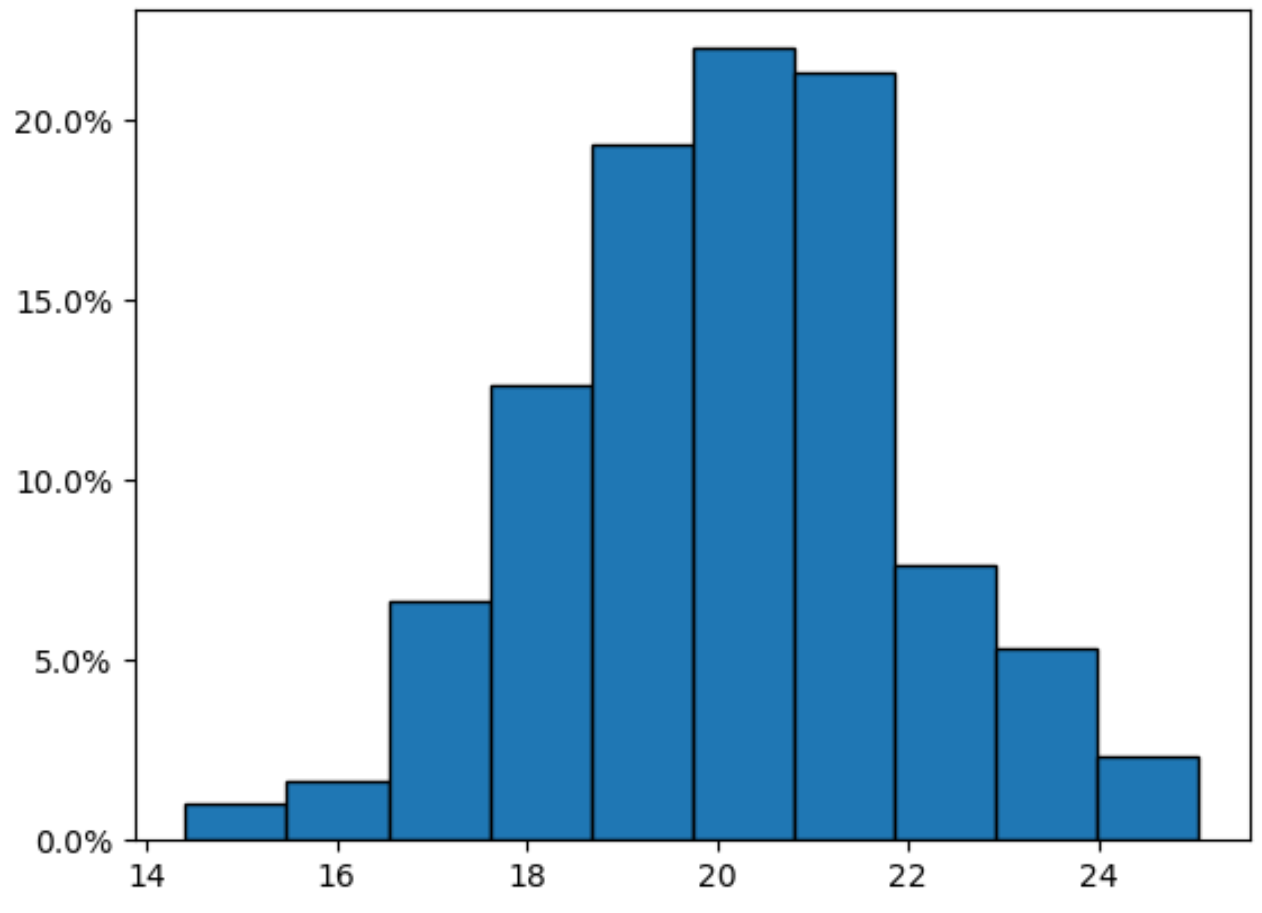
Y 軸にパーセンテージが表示されることに注意してください。
パーセンテージから小数点以下の桁を削除したい場合は、 PercentFormatter()関数でdecimals=0引数を使用するだけです。
 import numpy as np
import matplotlib. pyplot as plt
from matplotlib. ticker import PercentFormatter

#create histogram, using percentages instead of counts
plt. hist (df[' points '], weights=np. ones ( len (df)) / len (df), edgecolor=' black ')

#apply percentage format to y-axis
plt. gca (). yaxis . set_major_formatter (PercentFormatter(1, decimals= 0 ))
plt. show ()
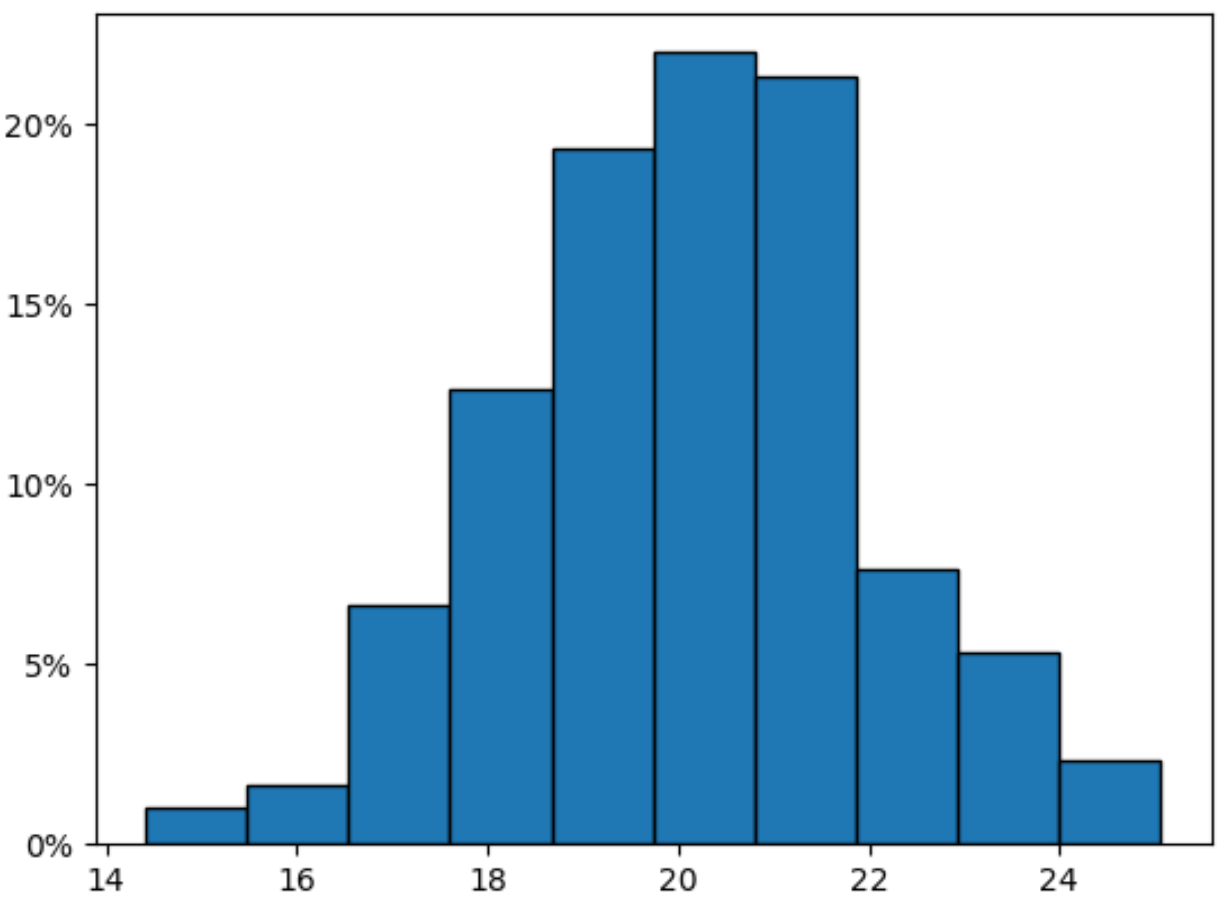
Y 軸には、小数点以下の桁なしでパーセンテージが表示されるようになりました。
追加リソース
次のチュートリアルでは、パンダで他の一般的なタスクを実行する方法を説明します。
Pandas ヒストグラムで使用されるビンの数を変更する方法
PandasヒストグラムのX軸の範囲を変更する方法
Pandas でグループごとにヒストグラムをプロットする方法
著者について
ベンジャミン・アンダーソン博士
私はベンジャミンです。退職した統計教授から、専任の Statorials 教育者になりました。 統計分野における豊富な経験と専門知識を活かして、私は Statorials を通じて学生に力を与えるために自分の知識を共有することに尽力しています。もっと知る