Pandas で指数移動平均を計算する方法
時系列分析では、移動平均は単に過去の多数の期間の平均値です。
指数移動平均は、最近の観測結果により重点を置くタイプの移動平均であり、最近の傾向をより迅速に把握できることを意味します。
このチュートリアルでは、pandas DataFrame の値の列の指数移動平均を計算する方法について説明します。
例: パンダの指数移動平均
次のパンダ データフレームがあるとします。
 import pandas as pd

#createDataFrame
df = pd.DataFrame({'period': [1, 2, 3, 4, 5, 6, 7, 8, 9, 10],
                   'sales': [25, 20, 14, 16, 27, 20, 12, 15, 14, 19]})

#view DataFrame
df

        period sales
0 1 25
1 2 20
2 3 14
3 4 16
4 5 27
5 6 20
6 7 12
7 8 15
8 9 14
9 10 19
pandas.DataFrame.ewm()関数を使用して、以前のいくつかの期間の指数加重移動平均を計算できます。
たとえば、前の 4 つの期間を使用して指数加重移動平均を計算する方法は次のとおりです。
 #create new column to hold 4-day exponentially weighted moving average
df['4dayEWM'] = df['sales']. ewm (span= 4 , adjust= False ). mean ()

#view DataFrame
df

        period sales 4dayEWM
0 1 25 25.000000
1 2 20 23.000000
2 3 14 19.400000
3 4 16 18.040000
4 5 27 21.624000
5 6 20 20.974400
6 7 12 17.384640
7 8 15 16.430784
8 9 14 15.458470
9 10 19 16.875082
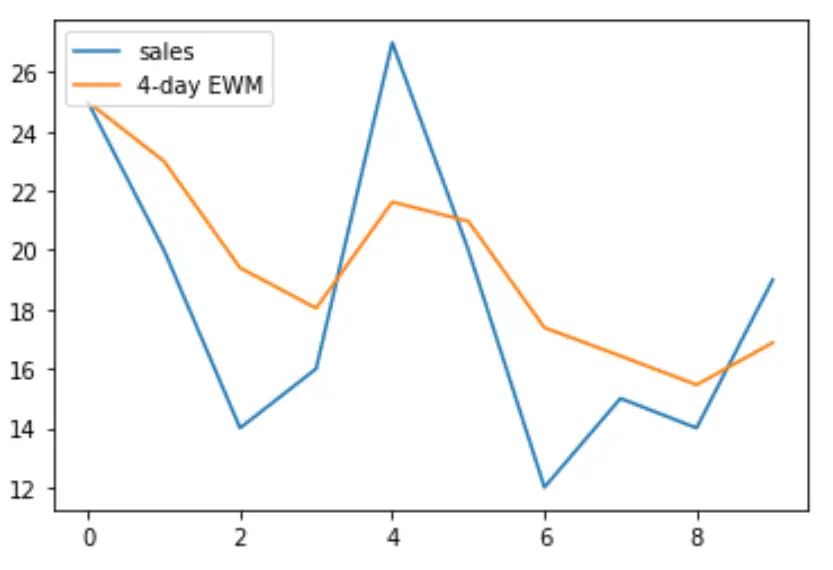
matplotlib ライブラリを使用して、4 日間の指数加重移動平均に対する売上を視覚化することもできます。
 import matplotlib.pyplot as plt

#plot sales and 4-day exponentially weighted moving average
plt. plot (df['sales'], label='Sales')
plt. plot (df['4dayEWM'], label='4-day EWM')

#add legend to plot
plt. legend (loc=2)
追加リソース
著者について
ベンジャミン・アンダーソン博士
私はベンジャミンです。退職した統計教授から、専任の Statorials 教育者になりました。 統計分野における豊富な経験と専門知識を活かして、私は Statorials を通じて学生に力を与えるために自分の知識を共有することに尽力しています。もっと知る