パンダ: 棒グラフの棒に注釈を付ける方法
次のメソッドを使用して、パンダの棒グラフの棒に注釈を付けることができます。
方法 1: 単純な棒グラフの棒に注釈を付ける
 ax = df. plot . bar ()

ax. bar_label ( ax.containers [ 0 ])
方法 2: グループ化された棒グラフの棒に注釈を付ける
 ax = df. plot . bar ()

for container in ax. containers :
    ax. bar_label (container)
次の例は、各メソッドを実際に使用する方法を示しています。
例 1: 単純な棒グラフの棒に注釈を付ける
次のコードは、単純な棒グラフの棒に注釈を付ける方法を示しています。
 import pandas as pd

#createDataFrame
df = pd. DataFrame ({' product ': ['A', 'B', 'C', 'D', 'E'],
                   ' sales ': [4, 7, 8, 15, 12]})

#view DataFrame
print (df)

  product sales
0 to 4
1 B 7
2 C 8
3 D 15
4 E 12

#create bar plot to visualize sales by product
ax = df. plot . bar (x=' product ', y=' sales ', legend= False )

#annotate bars
ax. bar_label ( ax.containers [ 0 ])
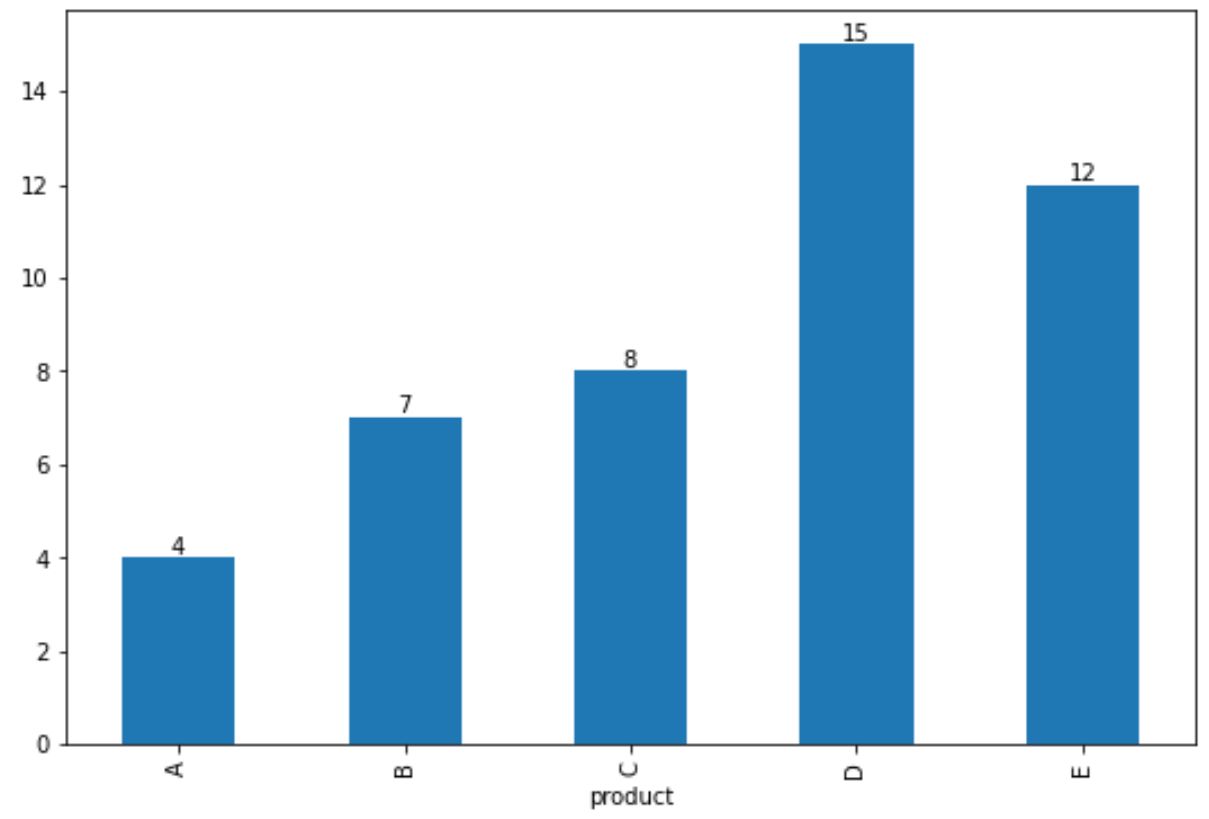
実際の売上高が各バーの上部に表示されることに注意してください。
例 2: グループ化された棒グラフの棒に注釈を付ける
次のコードは、グループ化された棒グラフの棒に注釈を付ける方法を示しています。
 #createDataFrame
df = pd. DataFrame ({' productA ': [14, 10],
                   ' productB ': [17, 19]},
                    index=['store 1', 'store 2'])

#view DataFrame
print (df)

         productA productB
store 1 14 17
store 2 10 19

#create grouped bar plot
ax = df. plot . bar ()

#annotate bars in bar plot
for container in ax. containers :
    ax. bar_label (container)
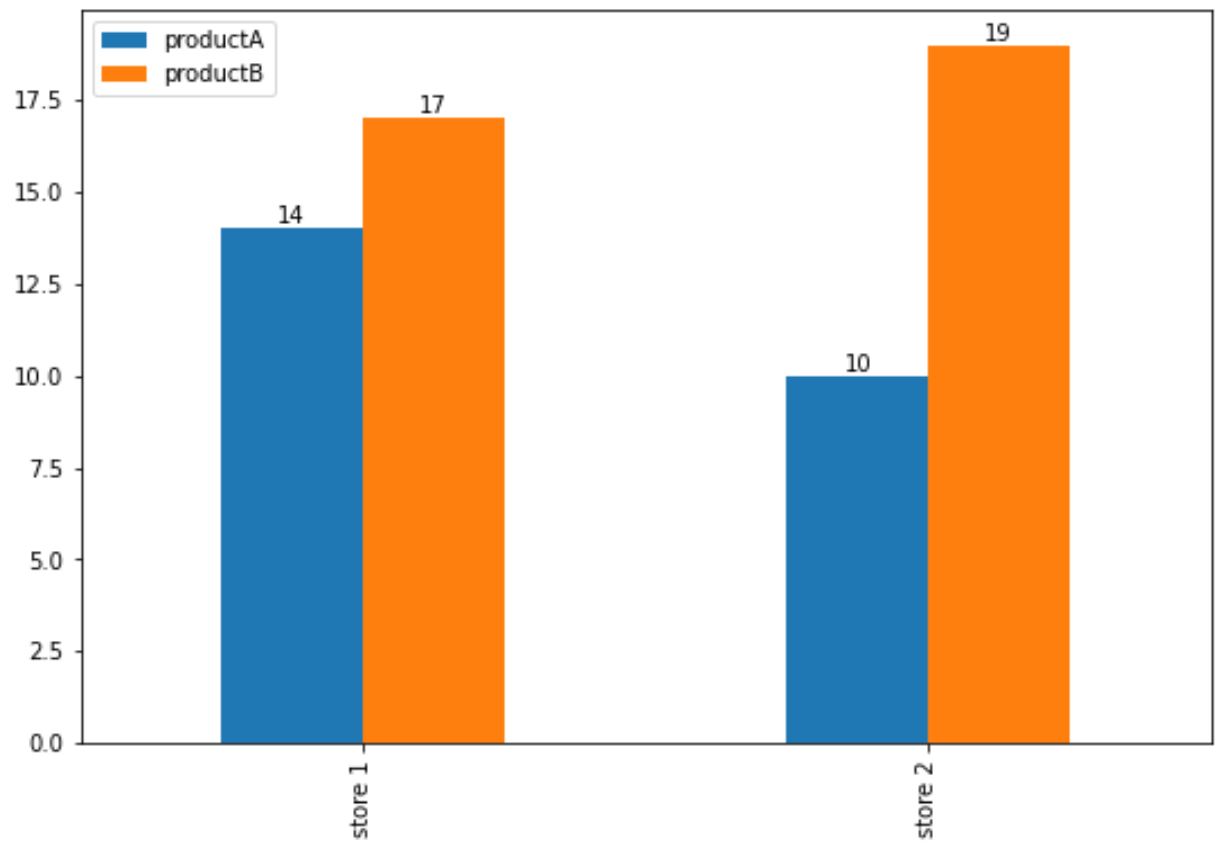
プロット内の個々のバーに注釈が追加されていることに注意してください。
追加リソース
次のチュートリアルでは、パンダで他の一般的なビジュアライゼーションを作成する方法を説明します。
Pandas DataFrame から箱ひげ図を作成する方法
Pandas DataFrame から円グラフを作成する方法
Pandas DataFrame からヒストグラムを作成する方法
著者について
ベンジャミン・アンダーソン博士
私はベンジャミンです。退職した統計教授から、専任の Statorials 教育者になりました。 統計分野における豊富な経験と専門知識を活かして、私は Statorials を通じて学生に力を与えるために自分の知識を共有することに尽力しています。もっと知る