Pandas dataframe から点群を作成する方法
pandas DataFrame のデータを使用して点群を作成するには 2 つの方法があります。
1. pandas.DataFrame.plot.scatter を使用する
散布図を作成する 1 つの方法は、pandas の組み込みのLot.scatter()関数を使用することです。
 import pandas as pd

df. plot . scatter (x = ' x_column_name ', y = ' y_columnn_name ')
2. matplotlib.pyplot.scatter を使用する
散布図を作成するもう 1 つの方法は、Matplotlib pyplot.scatter()関数を使用することです。
 import matplotlib. pyplot as plt

plt. scatter (df.x, df.y)
このチュートリアルでは、これらの各メソッドの使用例を示します。
例 1: パンダの使用
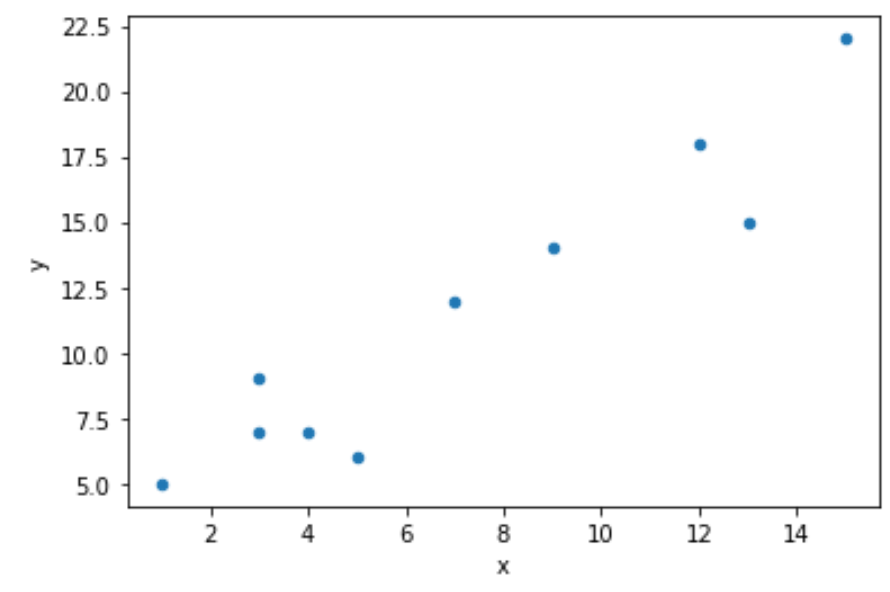
次のコードは、 plot.scatter()関数を使用して単純な散布図を作成する方法を示しています。
 import pandas as pd

#createDataFrame
df = pd. DataFrame ({'x': [1, 3, 3, 4, 5, 7, 9, 12, 13, 15],
                   'y': [5, 7, 9, 7, 6, 12, 14, 18, 15, 22]})

#create scatterplot
df. plot . scatter (x=' x ', y=' y ')
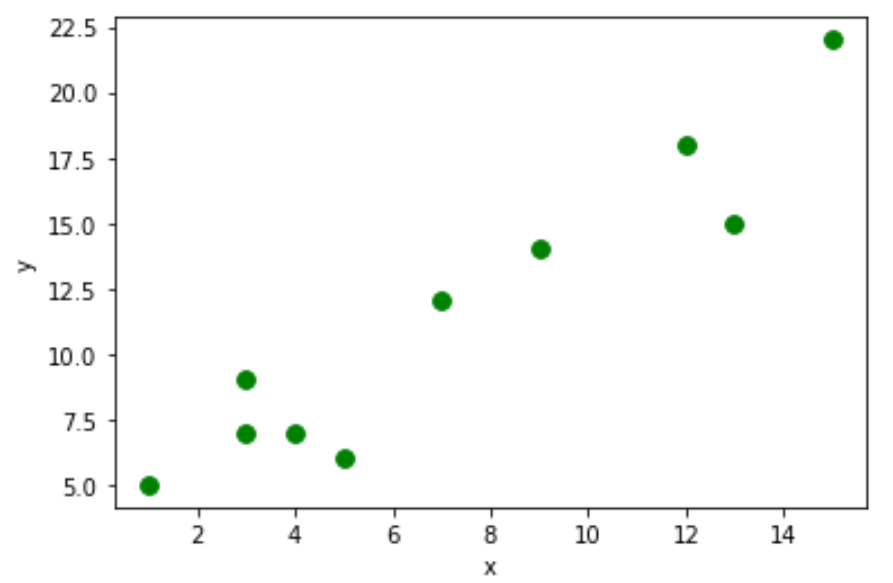
s引数とc引数を使用して、それぞれポイントのサイズと色を変更できることに注意してください。
df. plot . scatter (x=' x ', y=' y ', s= 60 , c=' green ')
例 2: Matplotlib の使用
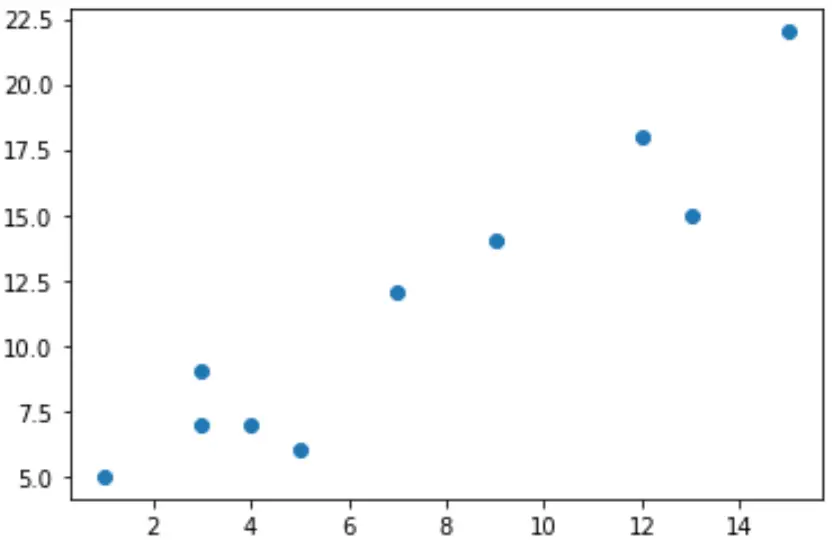
次のコードは、 pyplot.scatter()関数を使用して散布図を作成する方法を示しています。
 import pandas as pd
import matplotlib. pyplot as plt

#createDataFrame
df = pd. DataFrame ({'x': [1, 3, 3, 4, 5, 7, 9, 12, 13, 15],
                   'y': [5, 7, 9, 7, 6, 12, 14, 18, 15, 22]})

#create scatterplot
plt. scatter (df.x, df.y)
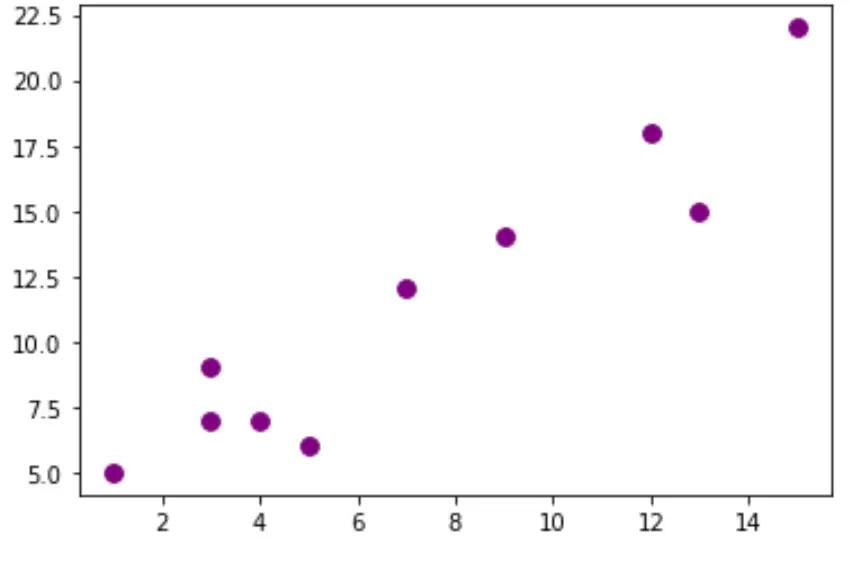
s引数とc引数を使用して、それぞれポイントのサイズと色を変更できることに注意してください。
plt. scatter (df.x, df.y, s= 60 , c=' purple ')
その他の Python チュートリアルはここで見つけることができます。
著者について
ベンジャミン・アンダーソン博士
私はベンジャミンです。退職した統計教授から、専任の Statorials 教育者になりました。 統計分野における豊富な経験と専門知識を活かして、私は Statorials を通じて学生に力を与えるために自分の知識を共有することに尽力しています。もっと知る