R でプロットの外側に凡例を描画する方法
基本 R プロットの外側に凡例を描画する最も簡単な方法は、次の構文を使用してプロットの右側に余分なスペースを追加することです。
by( mar =c(5, 4, 4, 8), xpd= TRUE )
次の段階的な例は、この構文を実際に使用する方法を示しています。
ステップ 1: データを作成する
まず、操作するデータを作成しましょう。
 #create data frames
df1 <- data. frame (x=c(1, 2, 3, 4, 5, 6, 7),
                  y=c(2, 7, 19, 26, 24, 29, 31))

df2 <- data. frame (x=c(1, 2, 3, 4, 5, 6, 7),
                  y=c(4, 4, 7, 9, 12, 13, 8))
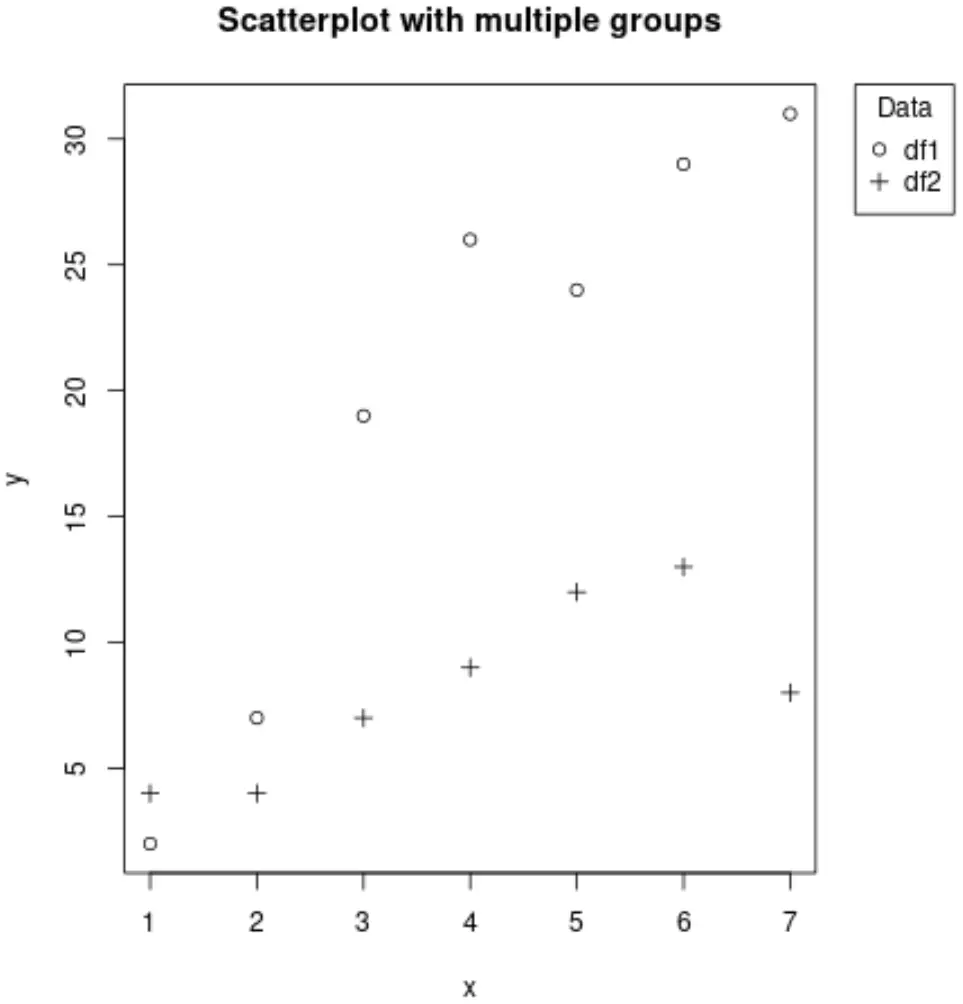
ステップ 2: プロットの外側に凡例を含むプロットを作成する
次に、パスを作成し、右上隅のパスの外側に凡例を追加しましょう。
 #add extra space to the right of the plot
by( mar =c(5, 4, 4, 8), xpd= TRUE )

#plot both data frames
plot(y ~ x, df1, pch =1, main=" Scatterplot with multiple groups ")
points(y ~ x, df2, pch =3)

#add legend outside of plot
legend(" topright ", inset =c(-0.2, 0), legend =c(" df1 "," df2 "), pch =c(1,3), title =" Data ")
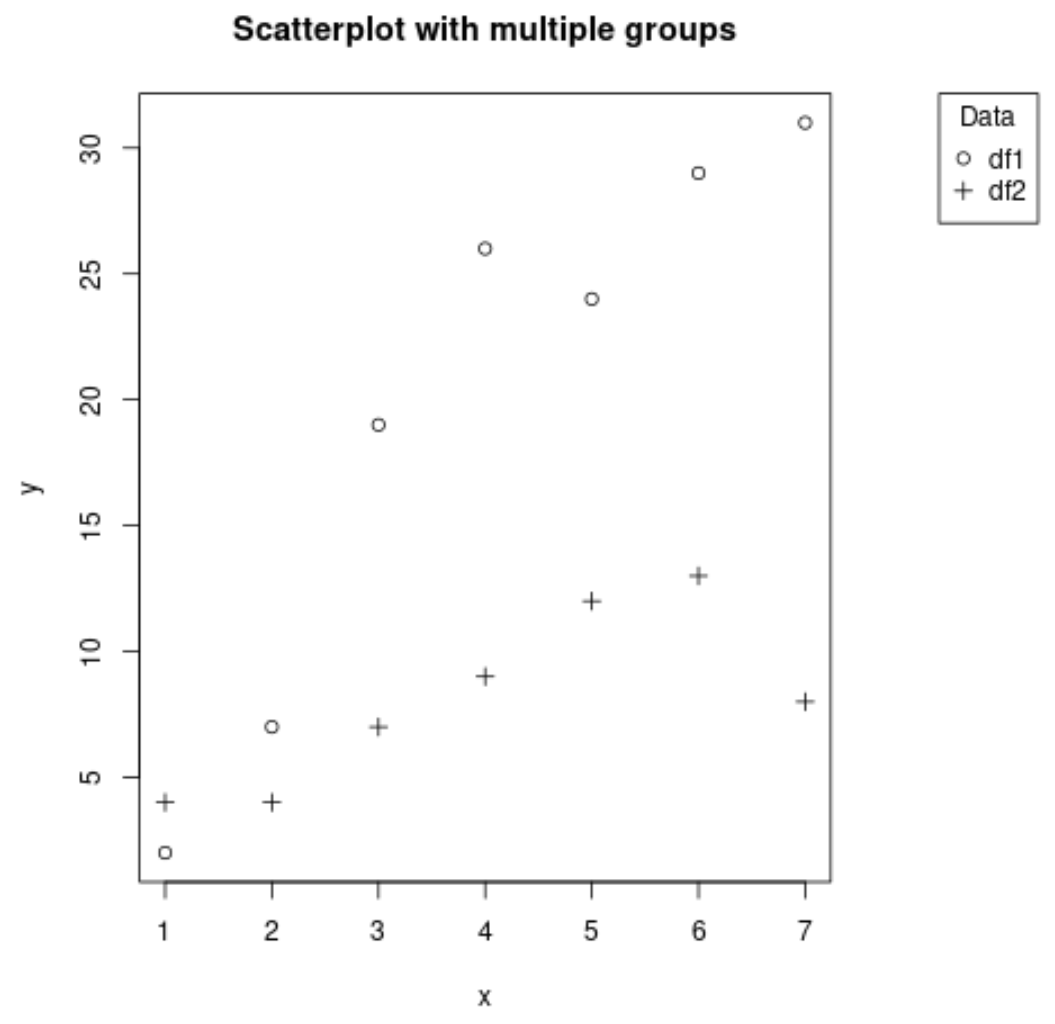
ステップ 3: 凡例の位置を変更する
inset(x, y)引数を使用して、プロットの右側の凡例の位置を制御できます。たとえば、引数x をより負の値にして、凡例をさらに右に移動することができます。
 #add extra space to the right of the plot
by( mar =c(5, 4, 4, 8), xpd= TRUE )

#plot both data frames
plot(y ~ x, df1, pch =1, main=" Scatterplot with multiple groups ")
points(y ~ x, df2, pch =3)

#add legend outside of plot
legend(" topright ", inset =c(-0.3, 0), legend =c(" df1 "," df2 "), pch =c(1,3), title =" Data ")
y引数をより正の値にして、凡例を下に押し出すこともできます。
 #add extra space to the right of the plot
by( mar =c(5, 4, 4, 8), xpd= TRUE )

#plot both data frames
plot(y ~ x, df1, pch =1, main=" Scatterplot with multiple groups ")
points(y ~ x, df2, pch =3)

#add legend outside of plot
legend(" topright ", inset =c(-0.3, .5), legend =c(" df1 "," df2 "), pch =c(1,3), title =" Data ")
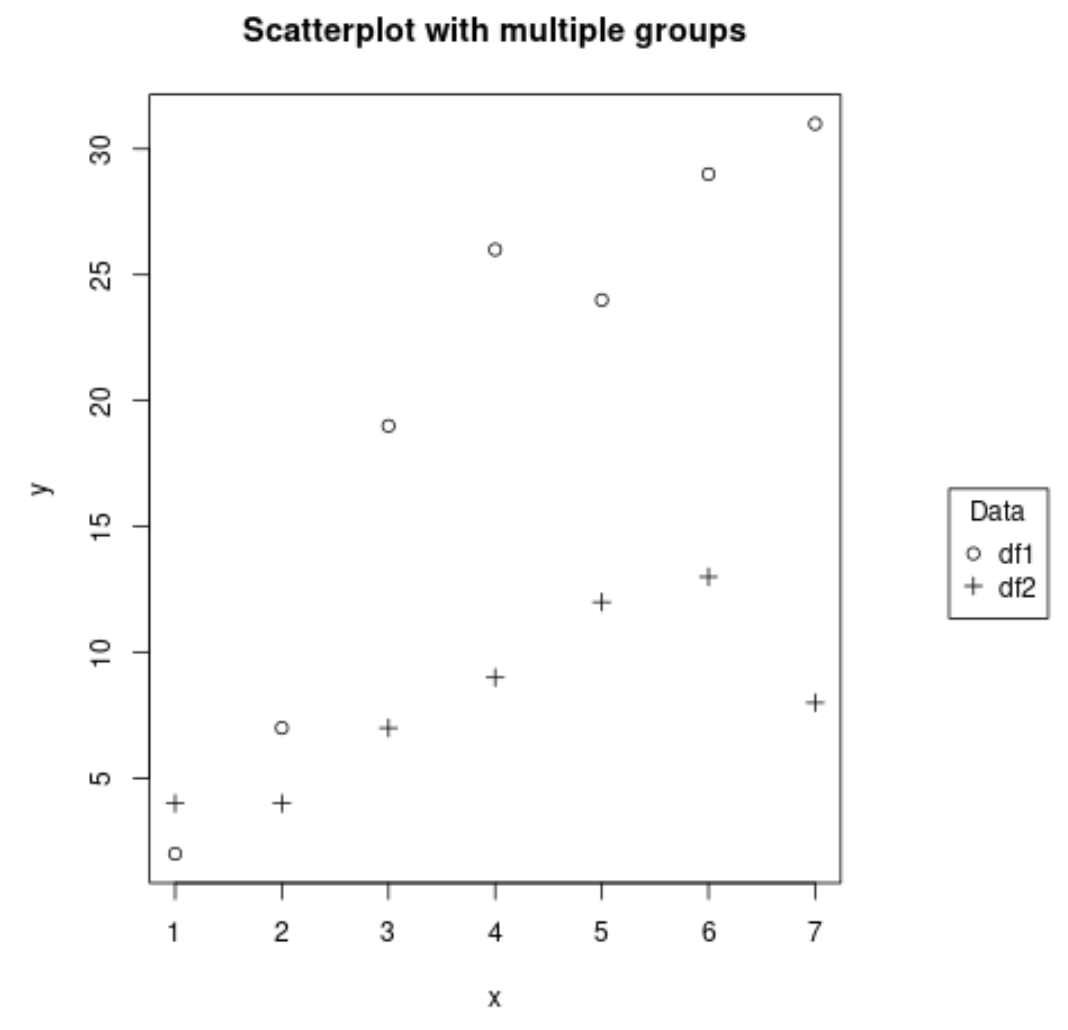
inset(x, y)引数の値を自由に変更して、凡例の位置を変更してください。
このページでは、その他の R チュートリアルを見つけることができます。
著者について
ベンジャミン・アンダーソン博士
私はベンジャミンです。退職した統計教授から、専任の Statorials 教育者になりました。 統計分野における豊富な経験と専門知識を活かして、私は Statorials を通じて学生に力を与えるために自分の知識を共有することに尽力しています。もっと知る