R で facet_wrap を使用する方法 (例あり)
facet_wrap()関数を使用すると、ggplot2 で複数パネルのプロットを生成できます。
この関数は次の基本構文を使用します。
 library (ggplot2)

ggplot(df, aes (x_var, y_var)) +
  geom_point() +
  facet_wrap(vars(category_var))
次の例は、R の組み込みmpgデータセットでこの関数を使用する方法を示しています。
 #view first six rows of mpg dataset
head(mpg)

manufacturer model displ year cyl trans drv cty hwy fl class

audi a4 1.8 1999 4 auto(l5) f 18 29 p compact
audi a4 1.8 1999 4 manual(m5) f 21 29 p compact
audi a4 2.0 2008 4 manual(m6) f 20 31 p compact
audi a4 2.0 2008 4 auto(front) f 21 30 p compact
audi a4 2.8 1999 6 auto(l5) f 16 26 p compact
audi a4 2.8 1999 6 manual(m5) f 18 26 p compact
例 1: facet_wrap() 基本関数
次のコードは、x 軸変数としてdispl 、y 軸変数としてhwy 、グループ化変数としてclassを使用して、ggplot2 で複数の散布図を作成する方法を示しています。
 ggplot(mpg, aes (displ, hwy)) +
  geom_point() +
  facet_wrap(vars(class))

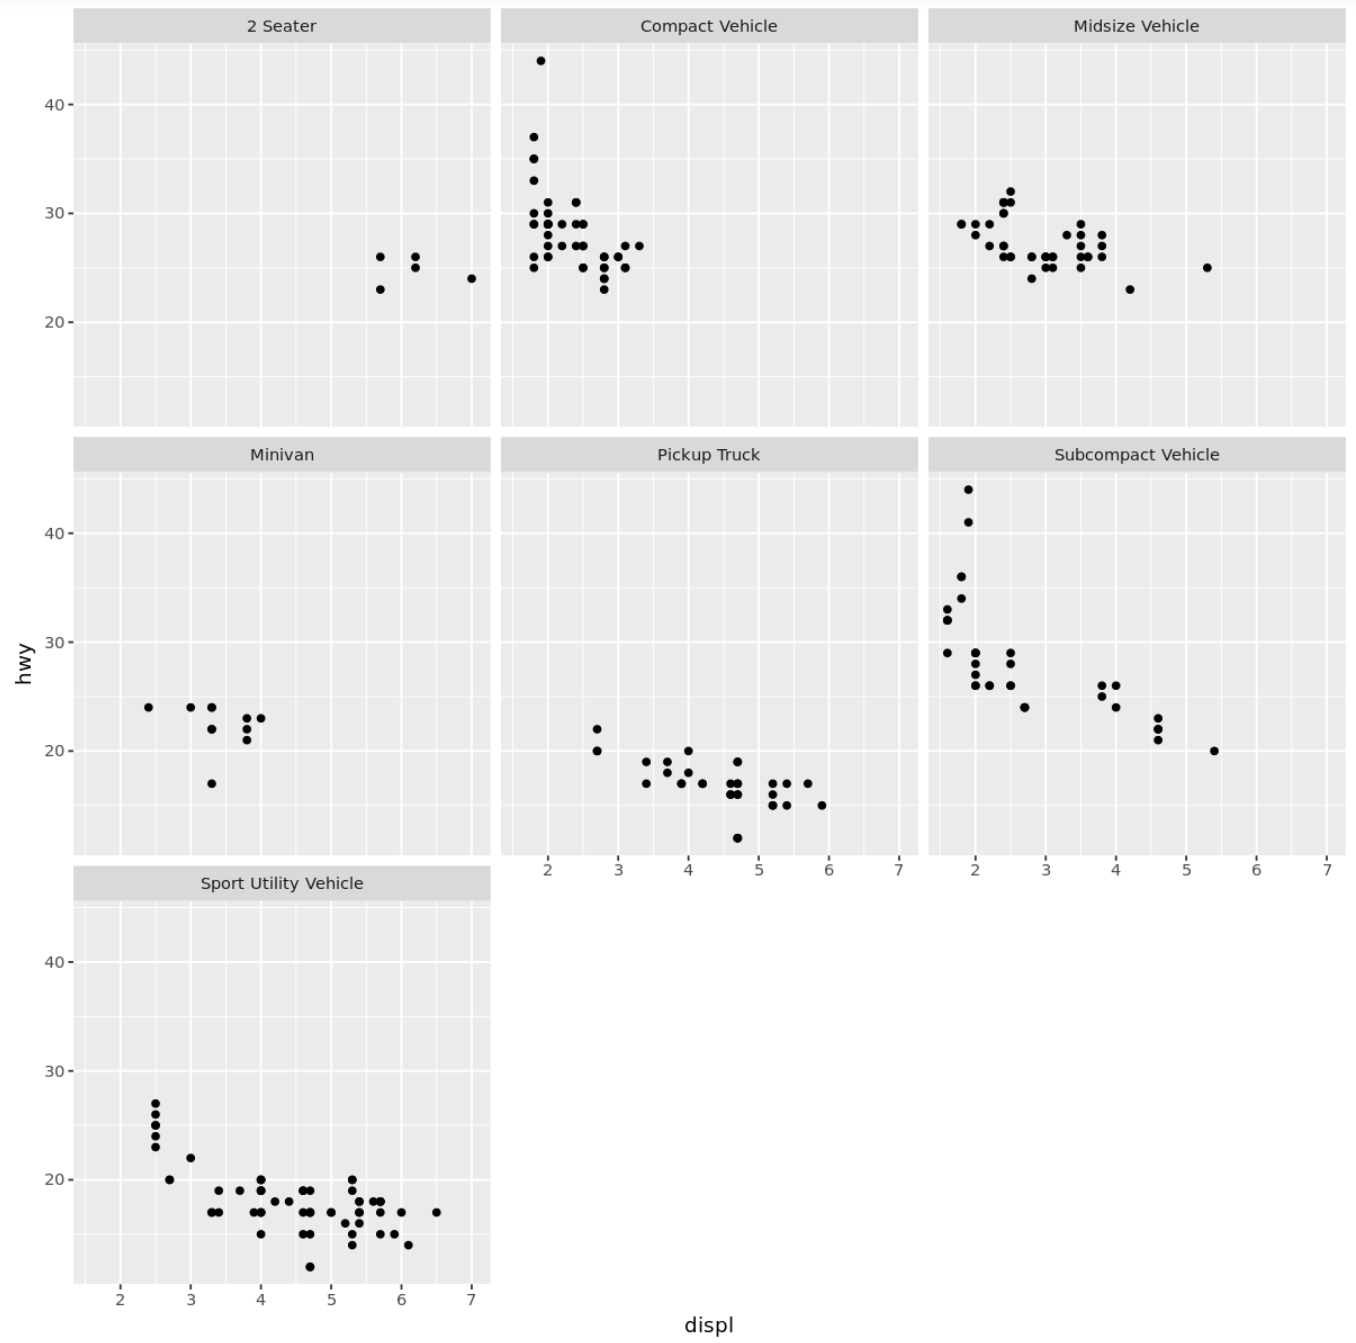
例 2: カスタム ラベルを使用する
次のコードは、プロット タイトルのカスタム ラベルでfacet_wrap()関数を使用する方法を示しています。
 #define custom labels
plot_names <- c('2seater' = "2 Seater",
                'compact' = "Compact Vehicle",
                'midsize' = "Midsize Vehicle",
                'minivan' = "Minivan",
                'pickup' = "Pickup Truck",
                'subcompact' = "Subcompact Vehicle",
                'suv' = "Sport Utility Vehicle")

#use facet_wrap with custom plot labels
ggplot(mpg, aes (displ, hwy)) +
  geom_point() +
  facet_wrap(vars(class), labeller = as_labeller (plot_names))

例 3: カスタム スケールを使用する
次のコードは、個々のプロットのカスタム スケールでfacet_wrap()関数を使用する方法を示しています。
 #use facet_wrap with custom scales
ggplot(mpg, aes (displ, hwy)) +
  geom_point() +
  facet_wrap(vars(class), scales=' free ')

例 4: カスタム コマンドの使用
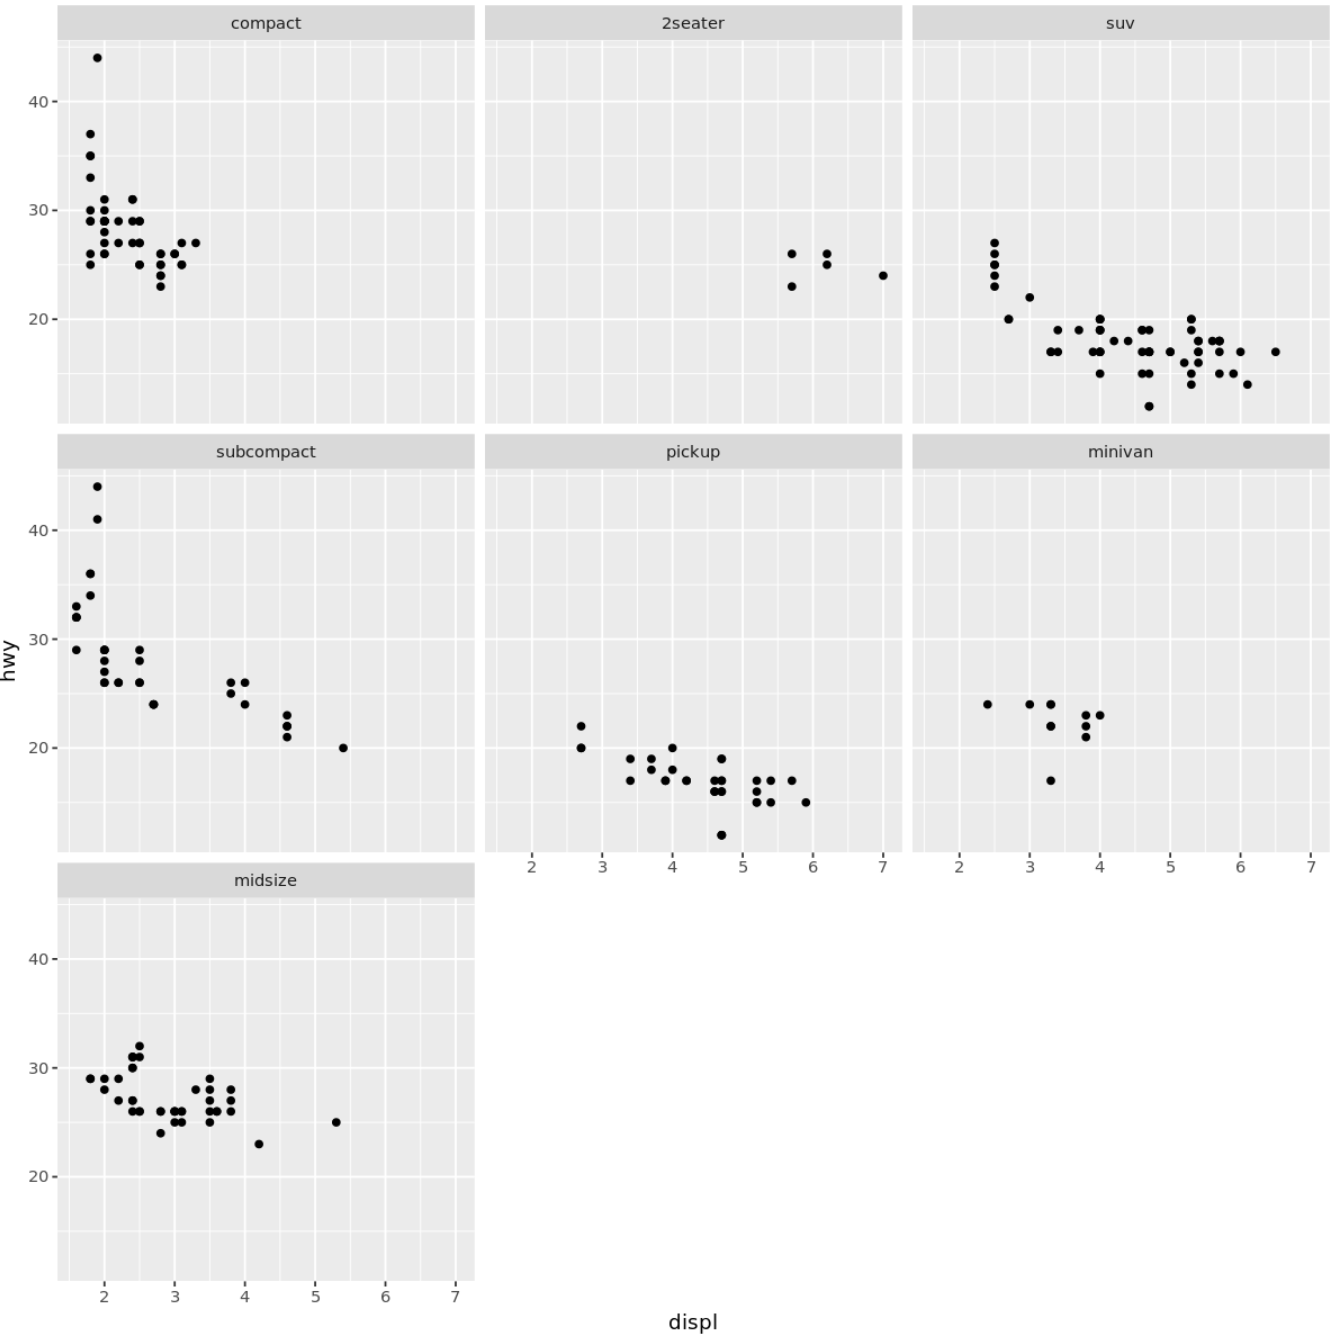
次のコードは、個々のプロットのカスタム順序でfacet_wrap()関数を使用する方法を示しています。
 #define order for plots
mpg <- within(mpg, class <- factor(class, levels=c(' compact ', ' 2seater ', ' suv ',
                                                   ' subcompact ', ' pickup ',
                                                   ' minivan ', ' midsize ')))

#use facet_wrap with custom order
ggplot(mpg, aes (displ, hwy)) +
  geom_point() +
  facet_wrap(vars(class))

プロットは指定した順序どおりに表示されることに注意してください。