Python でベルカーブを作成する方法
「ベル カーブ」は、正規分布の形状に付けられたニックネームで、明確な「ベル」形状を持っています。
このチュートリアルでは、Python でベル カーブを作成する方法を説明します。
Python でベルカーブを作成する方法
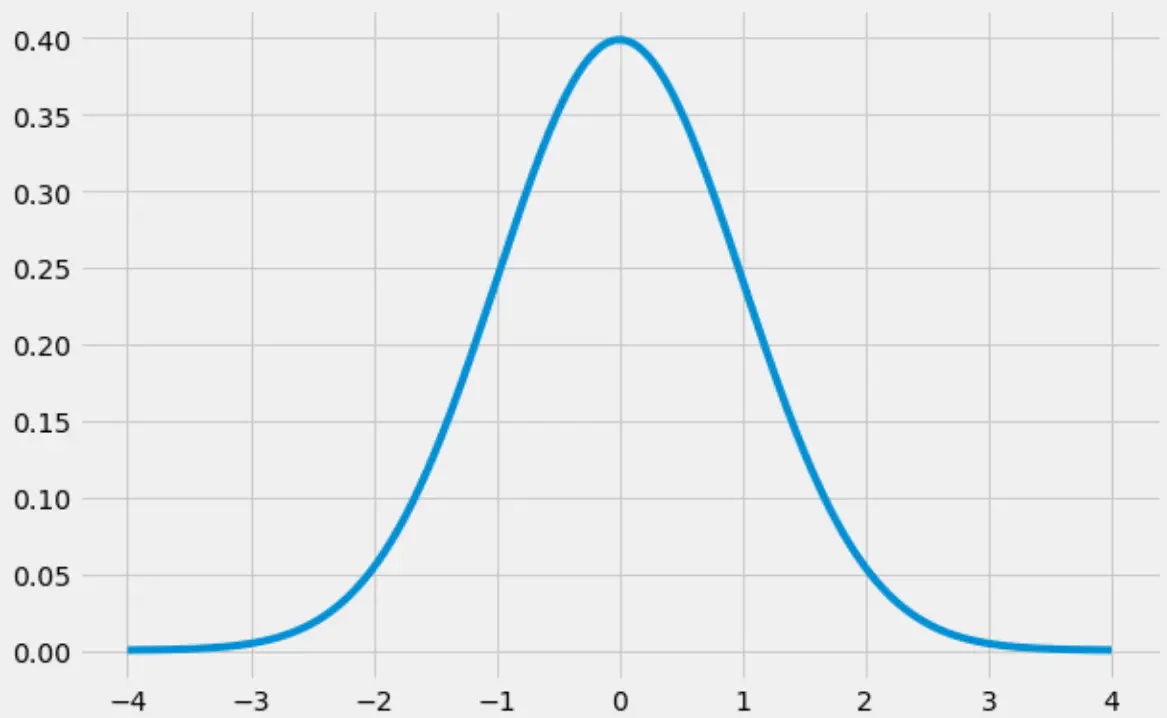
次のコードは、 numpy 、 scipy 、およびmatplotlibライブラリを使用して釣鐘曲線を作成する方法を示しています。
 import numpy as np
import matplotlib.pyplot as plt
from scipy.stats import norm

#create range of x-values from -4 to 4 in increments of .001
x = np.arange(-4, 4, 0.001)

#create range of y-values that correspond to normal pdf with mean=0 and sd=1
y = norm.pdf(x,0,1)

#defineplot
fig, ax = plt.subplots(figsize=(9,6))
ax.plot(x,y)

#choose plot style and display the bell curve
plt.style.use('fivethirtyeight')
plt.show()
Python でベルカーブを埋める方法
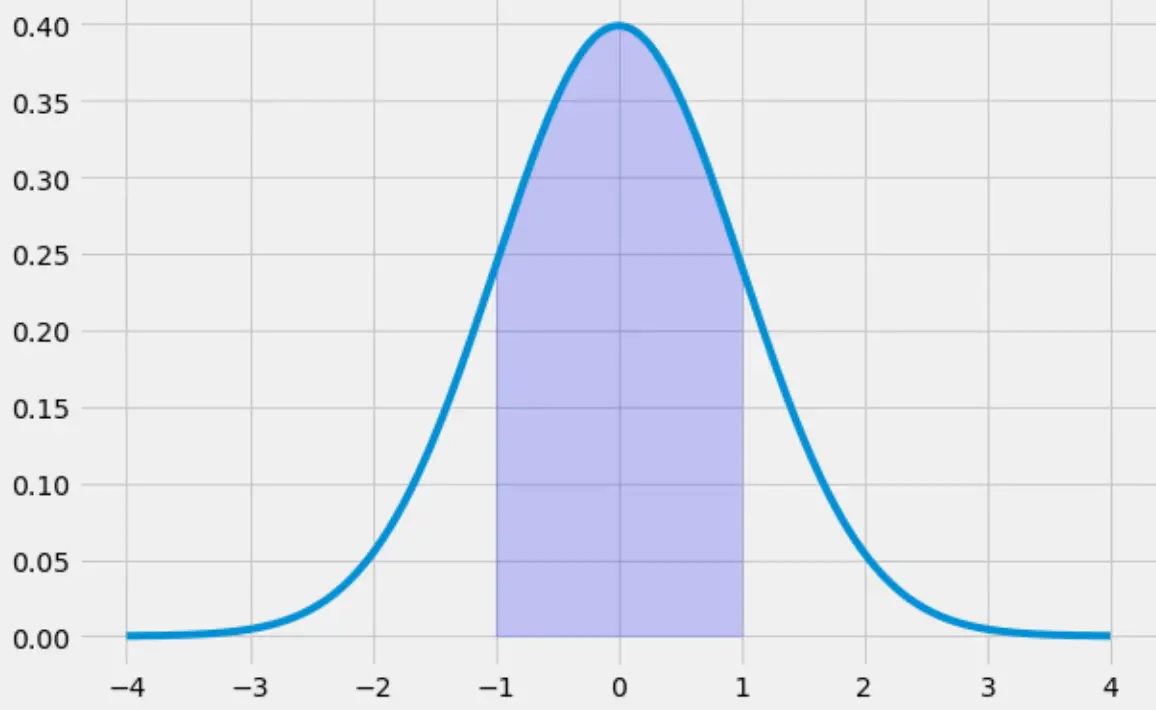
次のコードは、-1 から 1 に向かう釣鐘曲線の下の領域を塗りつぶす方法を示しています。
 x = np.arange(-4, 4, 0.001)
y = norm.pdf(x,0,1)

fig, ax = plt.subplots(figsize=(9,6))
ax.plot(x,y)

#specify the region of the bell curve to fill in
x_fill = np.arange(-1, 1, 0.001)
y_fill = norm.pdf(x_fill,0,1)
ax.fill_between(x_fill,y_fill,0, alpha=0.2, color='blue')

plt.style.use('fivethirtyeight')
plt.show()
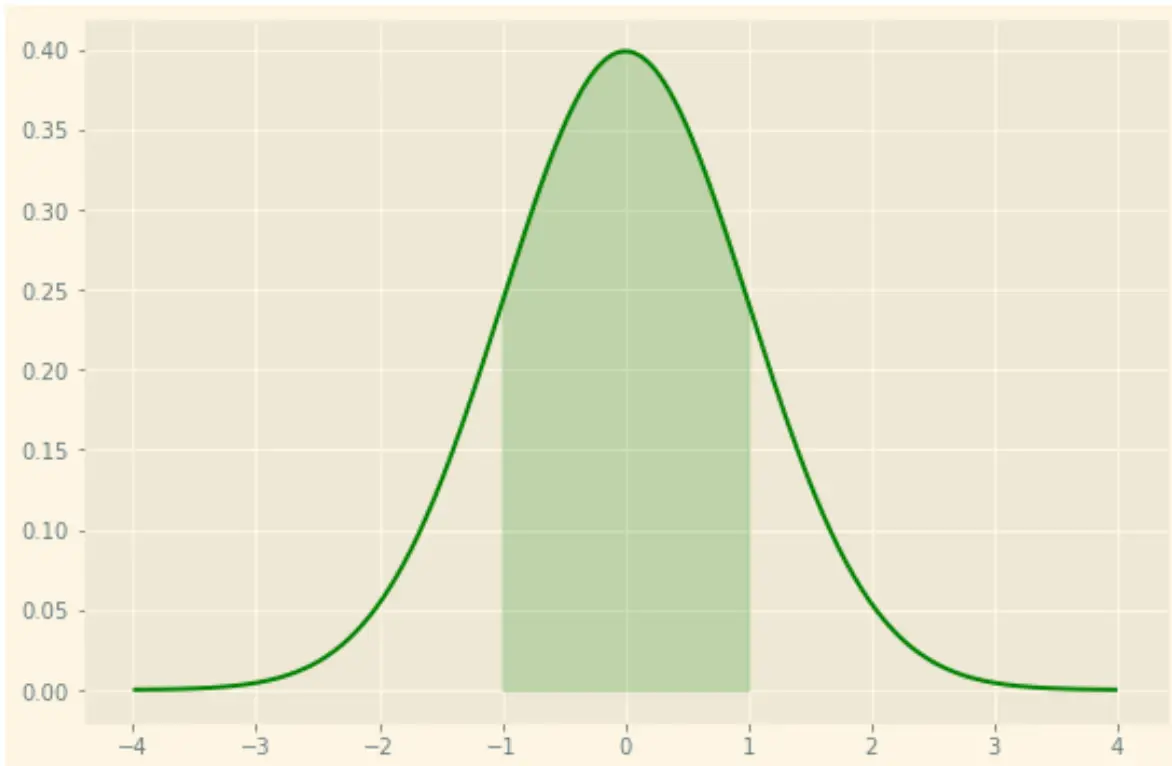
matplotlib の多くのスタイル オプションを使用して、プロットを自由にスタイル設定することもできることに注意してください。たとえば、緑色の線と緑色の陰影を持つ「日光」テーマを使用できます。
 x = np.arange(-4, 4, 0.001)
y = norm.pdf(x,0,1)

fig, ax = plt.subplots(figsize=(9,6))
ax.plot(x,y, color=' green ')

#specify the region of the bell curve to fill in
x_fill = np.arange(-1, 1, 0.001)
y_fill = norm.pdf(x_fill,0,1)
ax.fill_between(x_fill,y_fill,0, alpha=0.2, color=' green ')

plt.style.use(' Solarize_Light2 ')
plt.show()
matplotlib の完全なスタイルシート リファレンス ガイドは、ここで見つけることができます。
追加リソース
著者について
ベンジャミン・アンダーソン博士
私はベンジャミンです。退職した統計教授から、専任の Statorials 教育者になりました。 統計分野における豊富な経験と専門知識を活かして、私は Statorials を通じて学生に力を与えるために自分の知識を共有することに尽力しています。もっと知る