Matplotlib で矢印を描く方法
Matplotlib で矢印を描くには、次の構文を使用するmatplotlib.pyplot.arrow関数を使用できます。
matplotlib.pyplot.arrow(x, y, dx, dy)
金:
- x、y:矢印の根元の x および y 座標
- dx、dy:矢印の x 方向と y 方向の長さ
このチュートリアルでは、この関数の実際の使用例をいくつか紹介します。
例 1: 単一の矢印を描画する
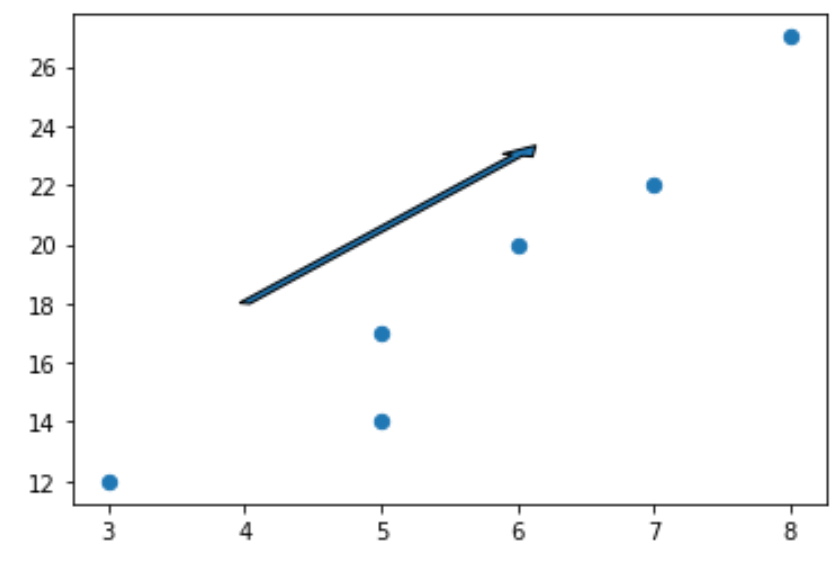
次のコードは、Matplotlib プロット上に単一の矢印を描画する方法を示しています。
 import matplotlib. pyplot as plt

#define two arrays for plotting
A = [3, 5, 5, 6, 7, 8]
B = [12, 14, 17, 20, 22, 27]

#create scatterplot, specifying marker size to be 40
plt. scatter (A, B, s= 40 )

#add arrow to plot
plt. arrow (x= 4 , y= 18 , dx= 2 , dy= 5 , width= .08 )

#displayplot
plt. show ()

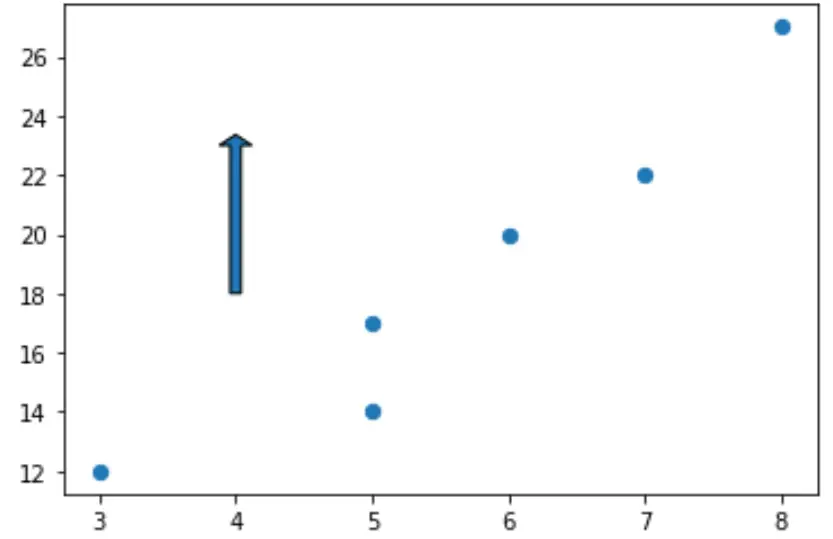
垂直矢印を作成するにはdx=0を設定し、水平矢印を作成するにはdy=0を設定できることに注意してください。
たとえば、垂直矢印を作成する方法は次のとおりです。
 import matplotlib. pyplot as plt

#define two arrays for plotting
A = [3, 5, 5, 6, 7, 8]
B = [12, 14, 17, 20, 22, 27]

#create scatterplot, specifying marker size to be 40
plt. scatter (A, B, s= 40 )

#add arrow to plot
plt. arrow (x= 4 , y= 18 , dx= 0 , dy= 5 , width= .08 )

#displayplot
plt. show ()

例 2: 矢印のスタイルを設定する
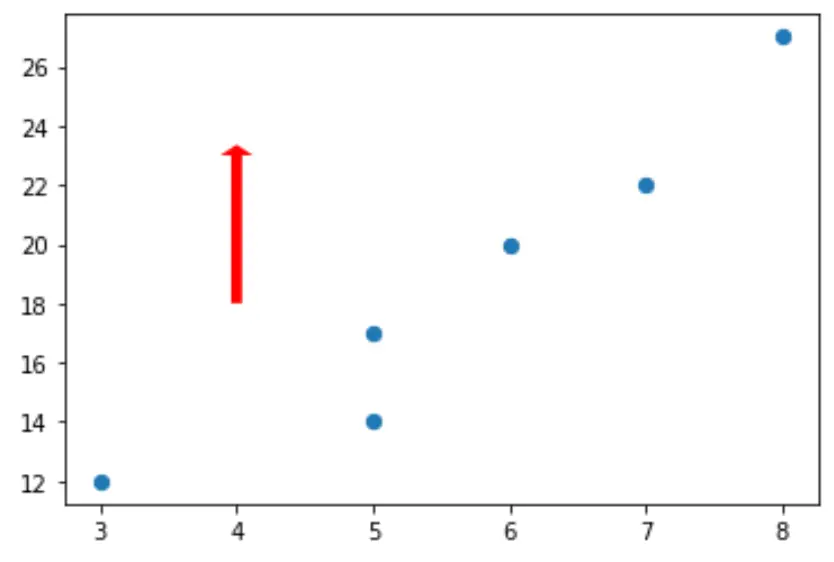
デフォルトでは、Matplotlib の矢印は青でエッジが黒ですが、 facecolorおよびedgecolor引数を使用してこれを簡単に変更できます。
 import matplotlib. pyplot as plt

#define two arrays for plotting
A = [3, 5, 5, 6, 7, 8]
B = [12, 14, 17, 20, 22, 27]

#create scatterplot, specifying marker size to be 40
plt. scatter (A, B, s= 40 )

#add arrow to plot
plt. arrow (x= 4 , y= 18 , dx= 0 , dy= 5 , width= .08 , facecolor= 'red' , edgecolor= 'none' )

#displayplot
plt. show ()

矢印に適用できるスタイル プロパティの完全なリストは、ここで見つけることができます。
例 3: 矢印に注釈を追加する
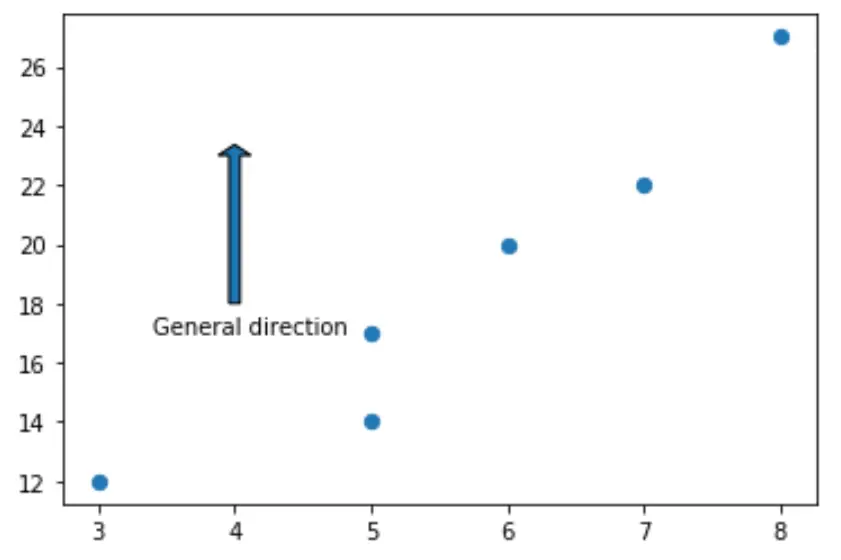
次のコードは、Matplotlib プロットの矢印の下に注釈を追加する方法を示しています。
 import matplotlib. pyplot as plt

#define two arrays for plotting
A = [3, 5, 5, 6, 7, 8]
B = [12, 14, 17, 20, 22, 27]

#create scatterplot, specifying marker size to be 40
plt. scatter (A, B, s= 40 )

#add arrow to plot
plt. arrow (x= 4 , y= 18 , dx= 0 , dy= 5 , width= .08 )

#add annotation
plt. annotate (' General direction ', xy = (3.4, 17))

#displayplot
plt. show ()
