単一の figure 内に複数の seaborn プロットを作成する方法
FacetGrid()関数を使用すると、単一の Figure 内に複数の Seaborn プロットを作成できます。
 #definegrid
g = sns. FacetGrid (data=df, col=' variable1 ', col_wrap= 2 )

#add plots to grid
g. map ( sns.scatterplot , ' variable2 ', ' variable3 ')
Col引数はラップする変数を指定し、 col_wrap引数は 1 行あたりに表示するプロットの数を指定することに注意してください。
次の例は、組み込みの「ヒント」データセットを使用してこの関数を実際に使用する方法を示しています。
 #load tips dataset
tips = sns. load_dataset (' tips ')

#view first five rows of tips dataset
tips. head ()

   total_bill tip sex smoker day time size
0 16.99 1.01 Female No Sun Dinner 2
1 10.34 1.66 Male No Sun Dinner 3
2 21.01 3.50 Male No Sun Dinner 3
3 23.68 3.31 Male No Sun Dinner 2
4 24.59 3.61 Female No Sun Dinner 4
例 1: 複数のパスを作成する
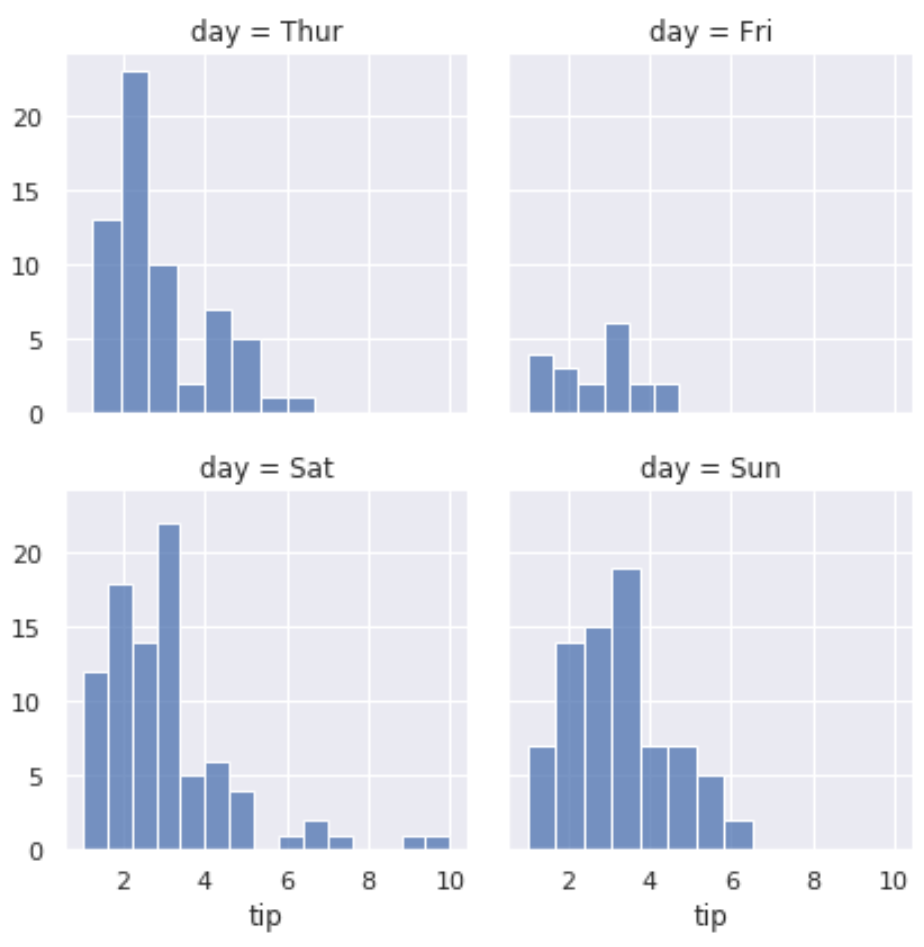
次のコードは、1 つの Figure 内に複数の Seaborn プロットを作成する方法を示しています。
 #define grid with two plots per row
g = sns. FacetGrid (data=tips, col=' day ', col_wrap= 2 )

#add histograms to each plot
g. map (sns. histplot , ' tip ')

この単純なコードで何をしたかを次に示します。
- 変数「day」でグループ化するように指定されています
- 1 行に 2 つのプロットを表示するように指定します
- 特定の日ごとの「チップ」値の分布を示すヒストグラムを各プロットに表示するように指定します
例 2: 特定の高さの複数のパスを作成する
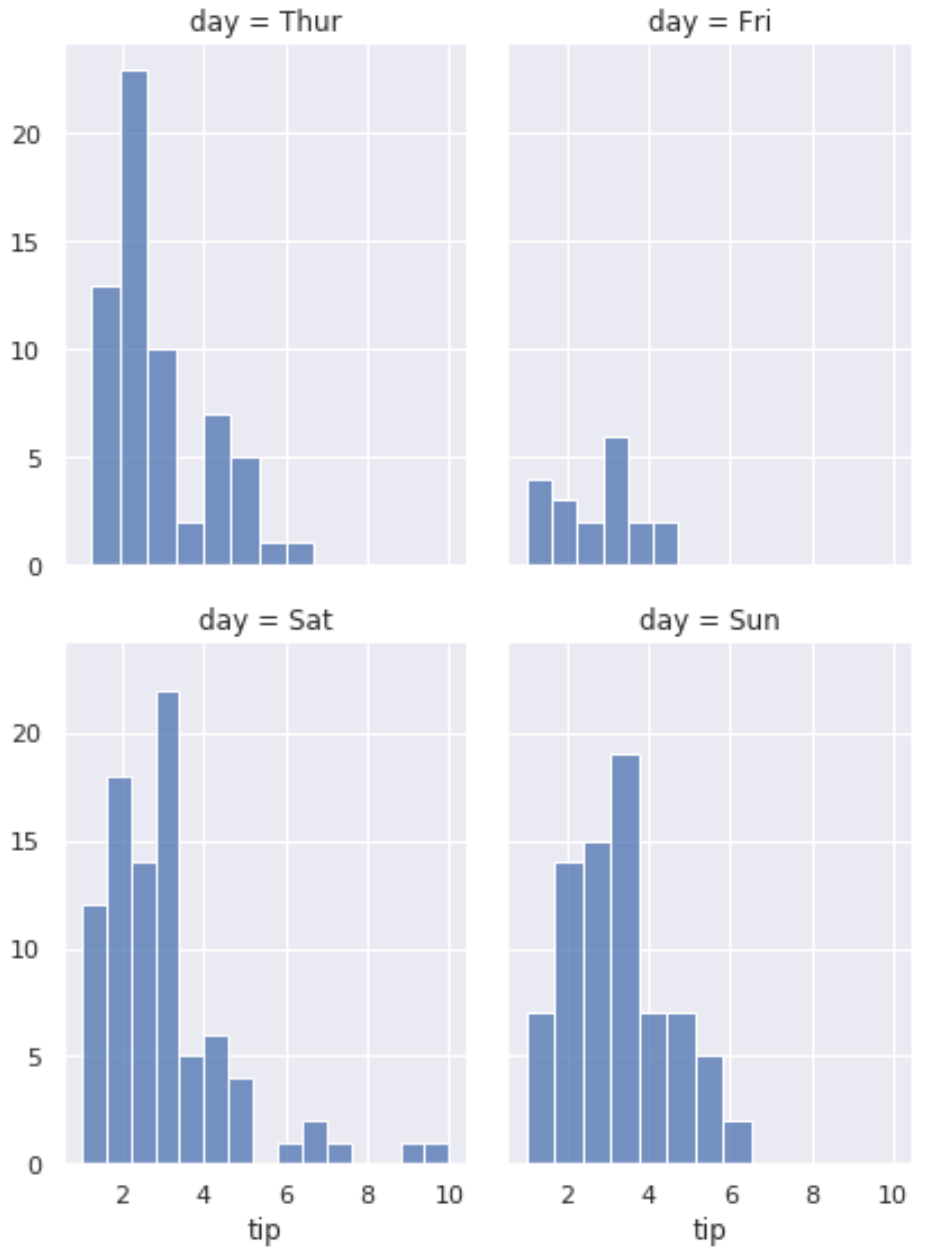
次のコードは、特定の高さとアスペクト比を持つ複数の Seaborn プロットを作成する方法を示しています。
 #definegrid
g = sns. FacetGrid (data=tips, col=' day ', col_wrap= 2 , height= 4 , aspect= .75 )

#add histograms to each plot
g. map (sns. histplot , ' tip ')

例 3:凡例を含む複数のプロットを作成する
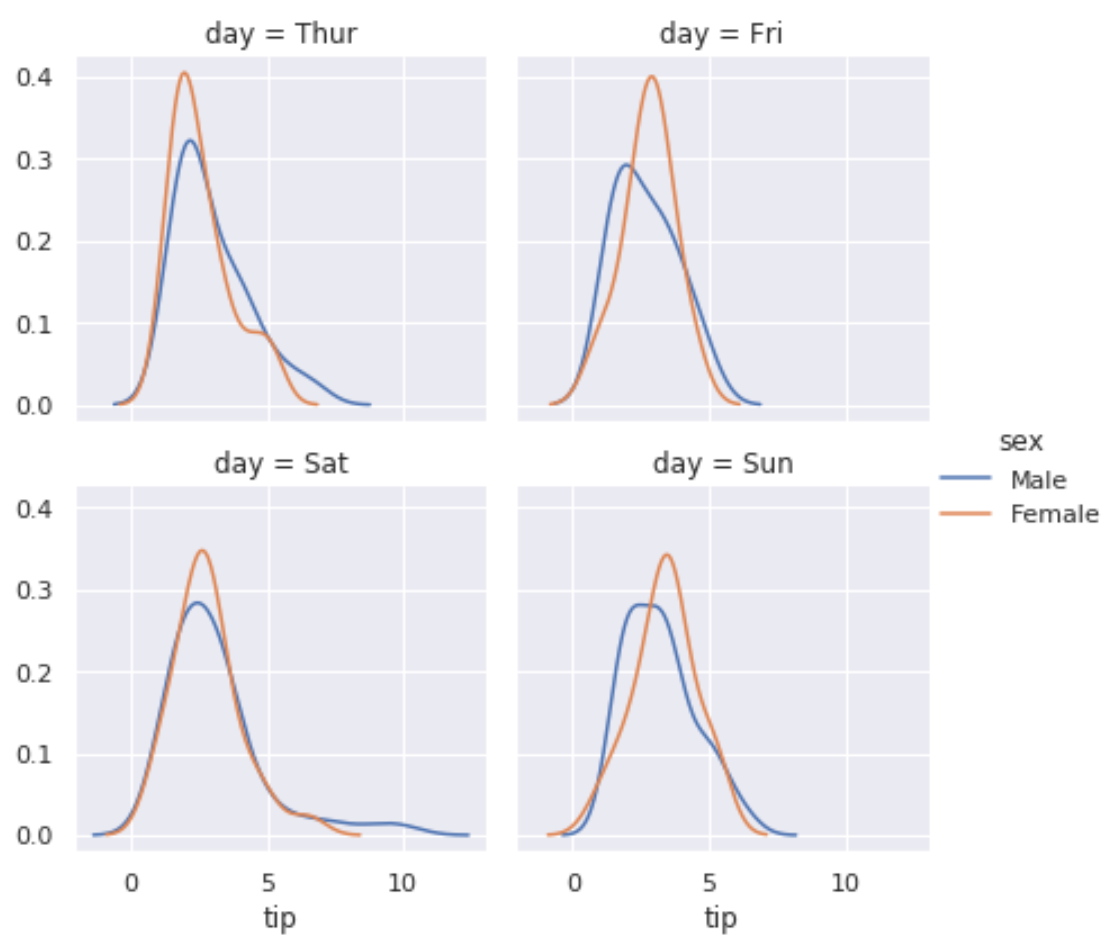
次のコードは、複数の Seaborn プロットを作成し、凡例を追加する方法を示しています。
 #definegrid
g = sns. FacetGrid (data=tips, col=' day ', hue=' sex ', col_wrap= 2 )

#add density plots to each plot
g. map ( sns.kdeplot , ' tip ')

#add legend
g. add_legend ()

追加リソース
Seaborn プロットにタイトルを追加する方法
Seaborn でレジェンドの位置を変更する方法
Seaborn プロットの図のサイズを調整する方法