R で散布図上の点にラベルを付ける方法 (例あり)
このチュートリアルでは、base R および ggplot2 の散布図上の点にラベルを付ける方法の例を示します。
例 1: Base R の点群点にラベルを付ける
基本 R の点群内の点にラベルを追加するには、次の構文を使用するtext()関数を使用できます。
テキスト (x、y、ラベルなど)
- x:ラベルの x 座標
- y:ラベルの y 座標
- ラベル:ラベルに使用するテキスト
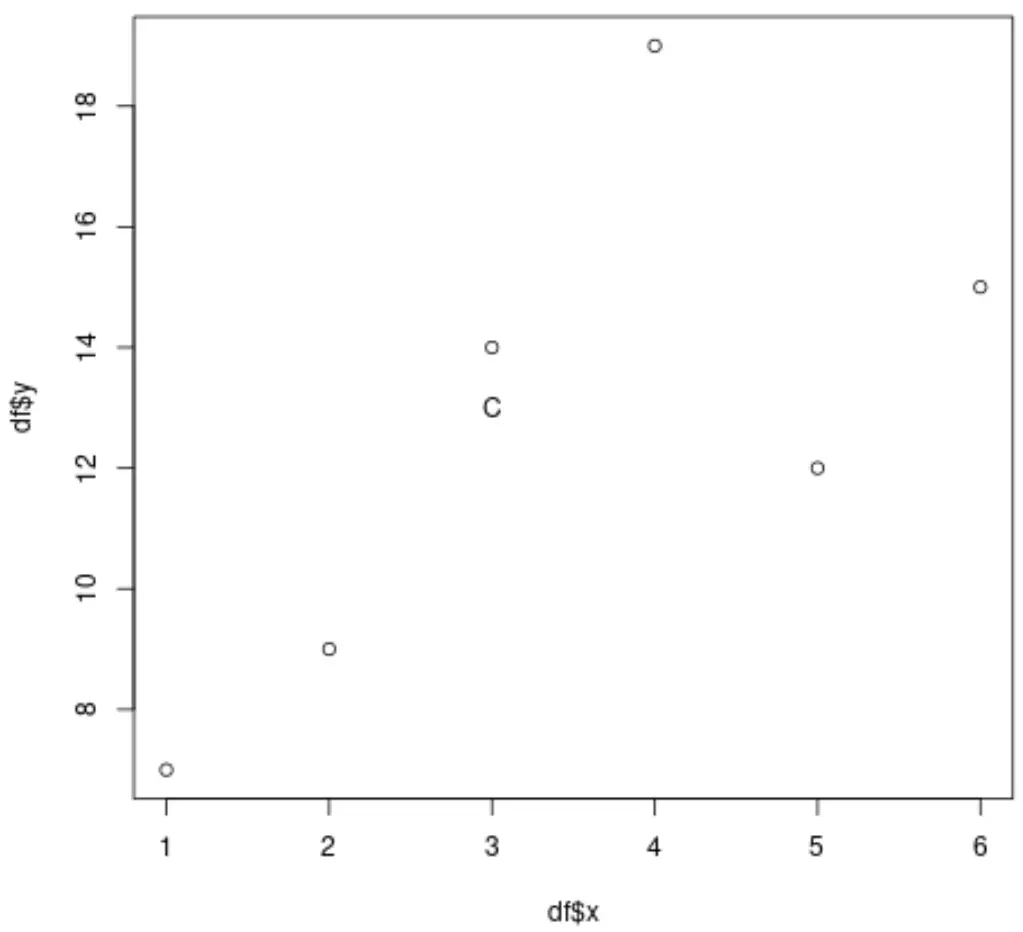
次のコードは、ベース R の点群上の単一点にラベルを付ける方法を示しています。
 #create data
df <- data. frame (x=c(1, 2, 3, 4, 5, 6),
                 y=c(7, 9, 14, 19, 12, 15),
                 z=c('A', 'B', 'C', 'D', 'E', 'F'))

#create scatterplot
plot(df$x, df$y)

#add label to third point in dataset
text(df$x[3], df$y[3]-1, labels=df$z[3])
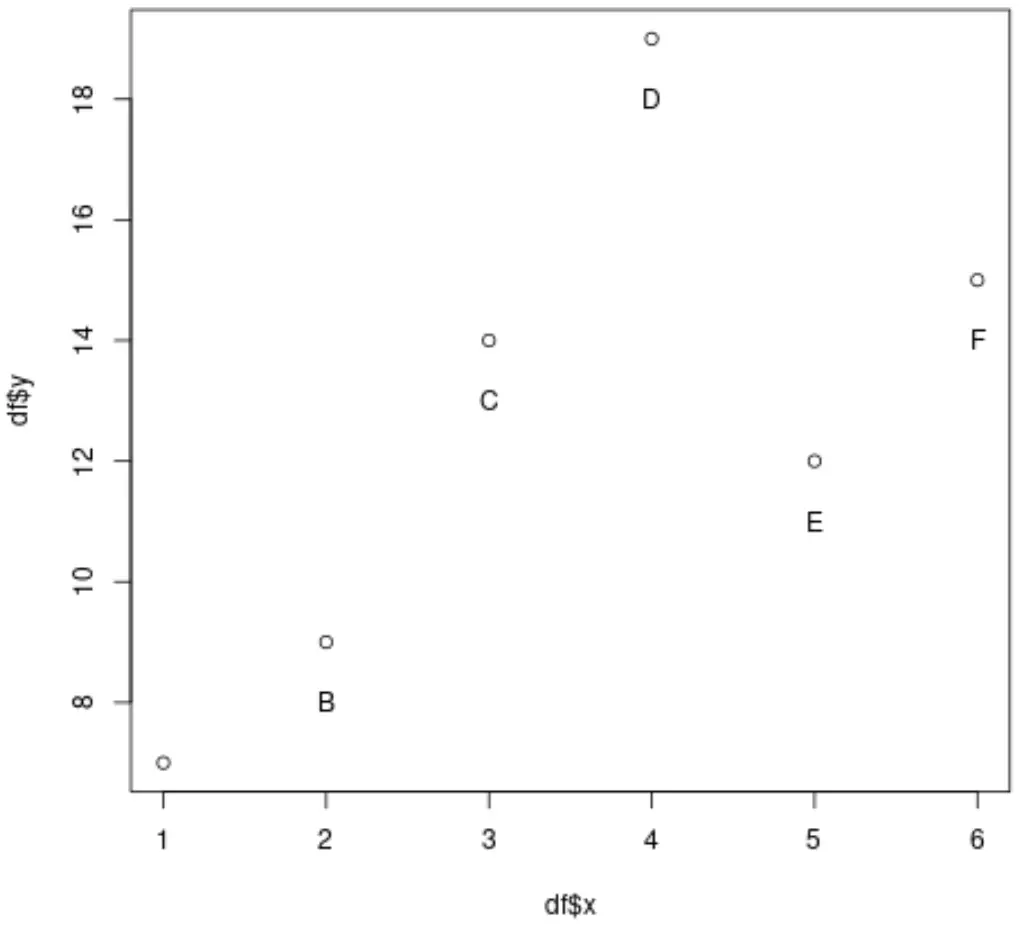
次のコードは、ベース R の点群内の各点にラベルを付ける方法を示しています。
 #create data
df <- data. frame (x=c(1, 2, 3, 4, 5, 6),
                 y=c(7, 9, 14, 19, 12, 15),
                 z=c('A', 'B', 'C', 'D', 'E', 'F'))

#create scatterplot
plot(df$x, df$y)

#add labels to every point
text(df$x, df$y-1, labels=df$z)
例 2: ggplot2 の散布図ポイントにラベルを付ける
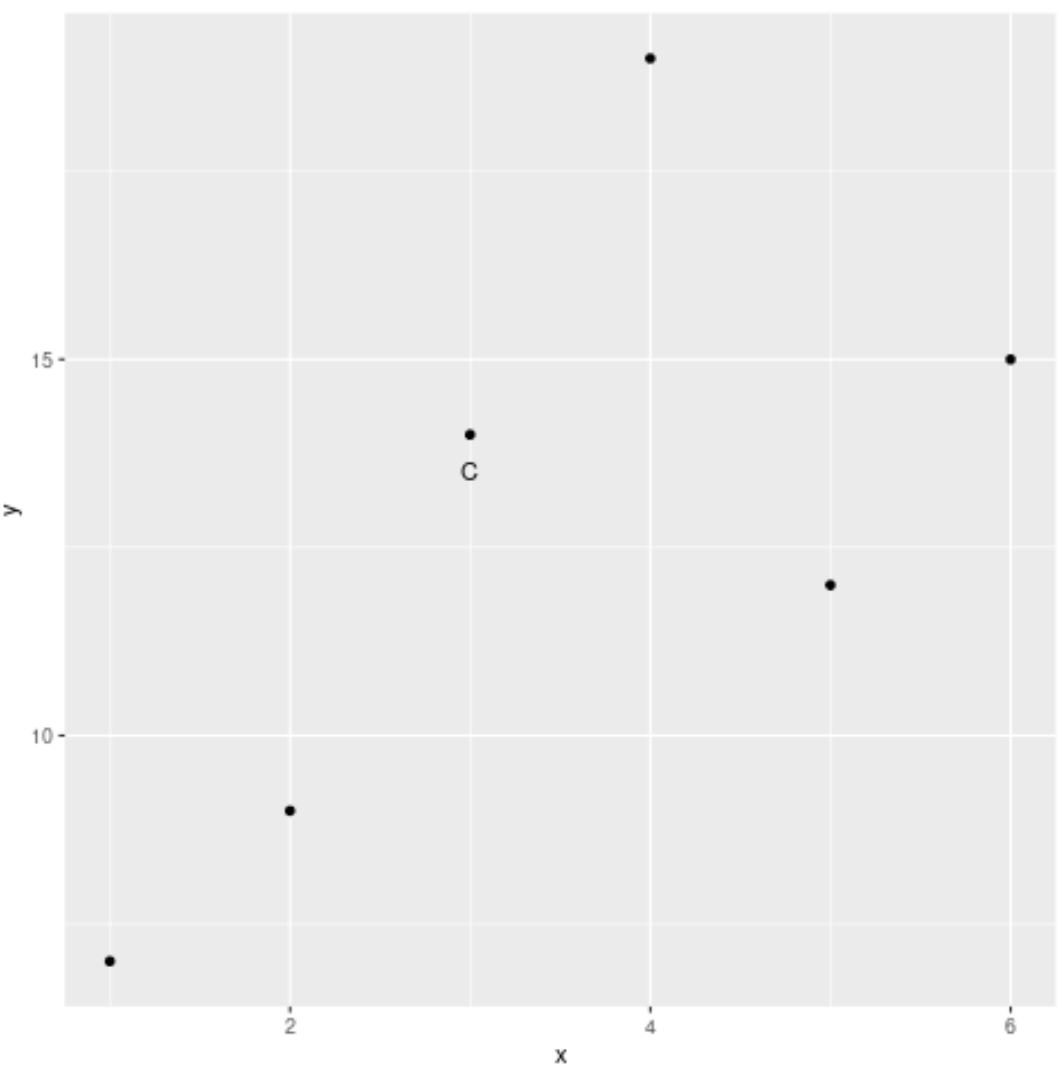
次のコードは、ggplot2 の散布図上の単一点にラベルを付ける方法を示しています。
 #load ggplot2
library (ggplot2)

#create data
df <- data. frame (x=c(1, 2, 3, 4, 5, 6),
                 y=c(7, 9, 14, 19, 12, 15),
                 z=c('A', 'B', 'C', 'D', 'E', 'F'))

#create scatterplot with a label on the third point in dataset
ggplot(df, aes (x,y)) +
  geom_point() +
  annotate(' text ', x = 3, y = 13.5, label = ' C ')
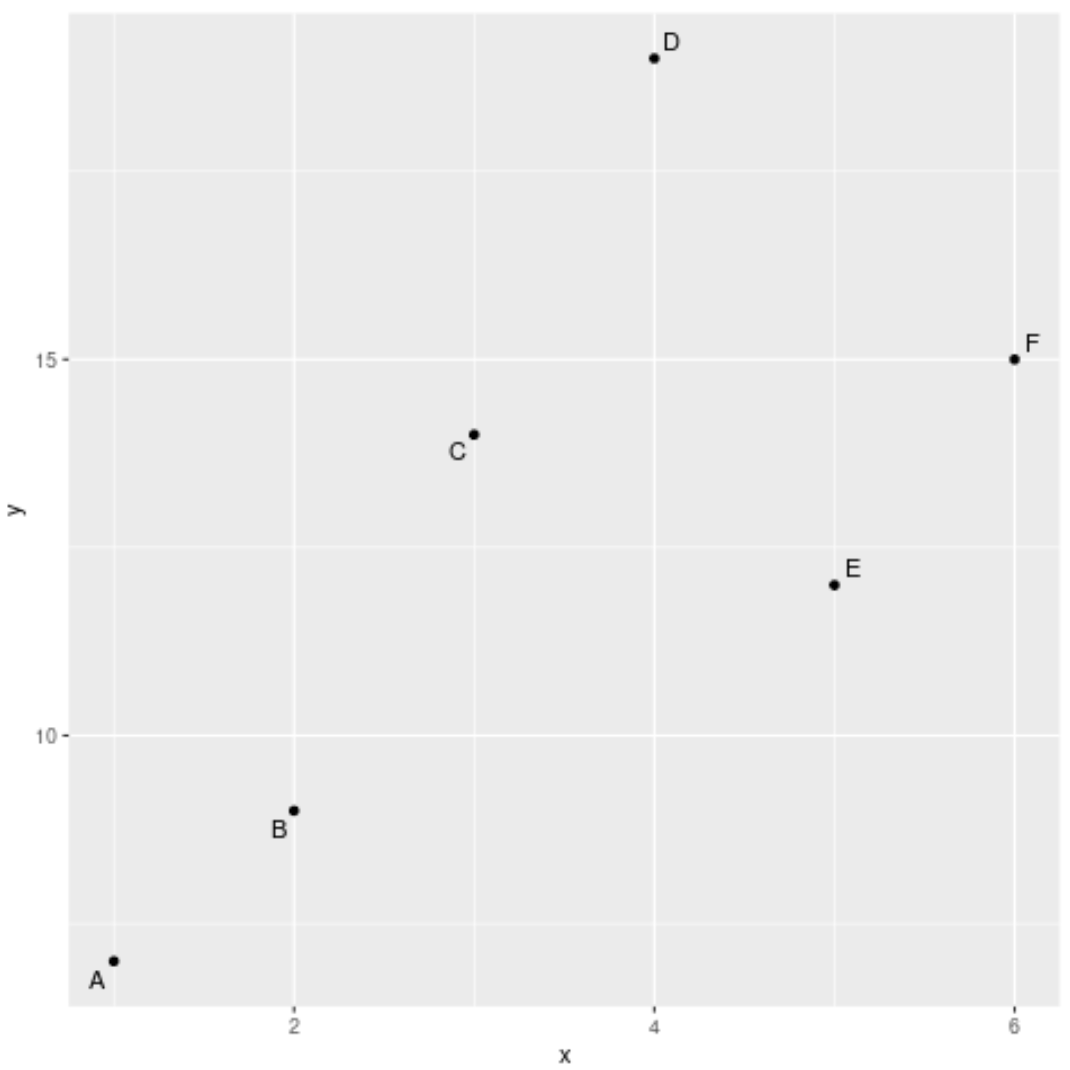
次のコードは、ggplot2 の散布図の各点にラベルを付ける方法を示しています。
 #load ggplot2 & ggrepel for easy annotations
library (ggplot2)
library (ggrepel)

#createdata
df <- data. frame (x=c(1, 2, 3, 4, 5, 6),
                 y=c(7, 9, 14, 19, 12, 15),
                 z=c('A', 'B', 'C', 'D', 'E', 'F'))

#create scatterplot with a label on every point
ggplot(df, aes (x,y)) +
  geom_point() +
  geom_text_repel( aes (label=z))
追加リソース
著者について
ベンジャミン・アンダーソン博士
私はベンジャミンです。退職した統計教授から、専任の Statorials 教育者になりました。 統計分野における豊富な経験と専門知識を活かして、私は Statorials を通じて学生に力を与えるために自分の知識を共有することに尽力しています。もっと知る