Ggplot2 で並列プロットを作成する方法
多くの場合、R のggplot2パッケージを使用して 2 つのプロットを並べて作成することができます。幸いなことに、これはpatchworkパッケージの助けを借りて簡単に行うことができます。
 #install ggplot2 and patchwork packages
install.packages(' ggplot2 ')
install.packages(' patchwork ')

#load the packages
library(ggplot2)
library(patchwork)
このチュートリアルでは、これらのパッケージを使用して並列プロットを作成する例をいくつか示します。
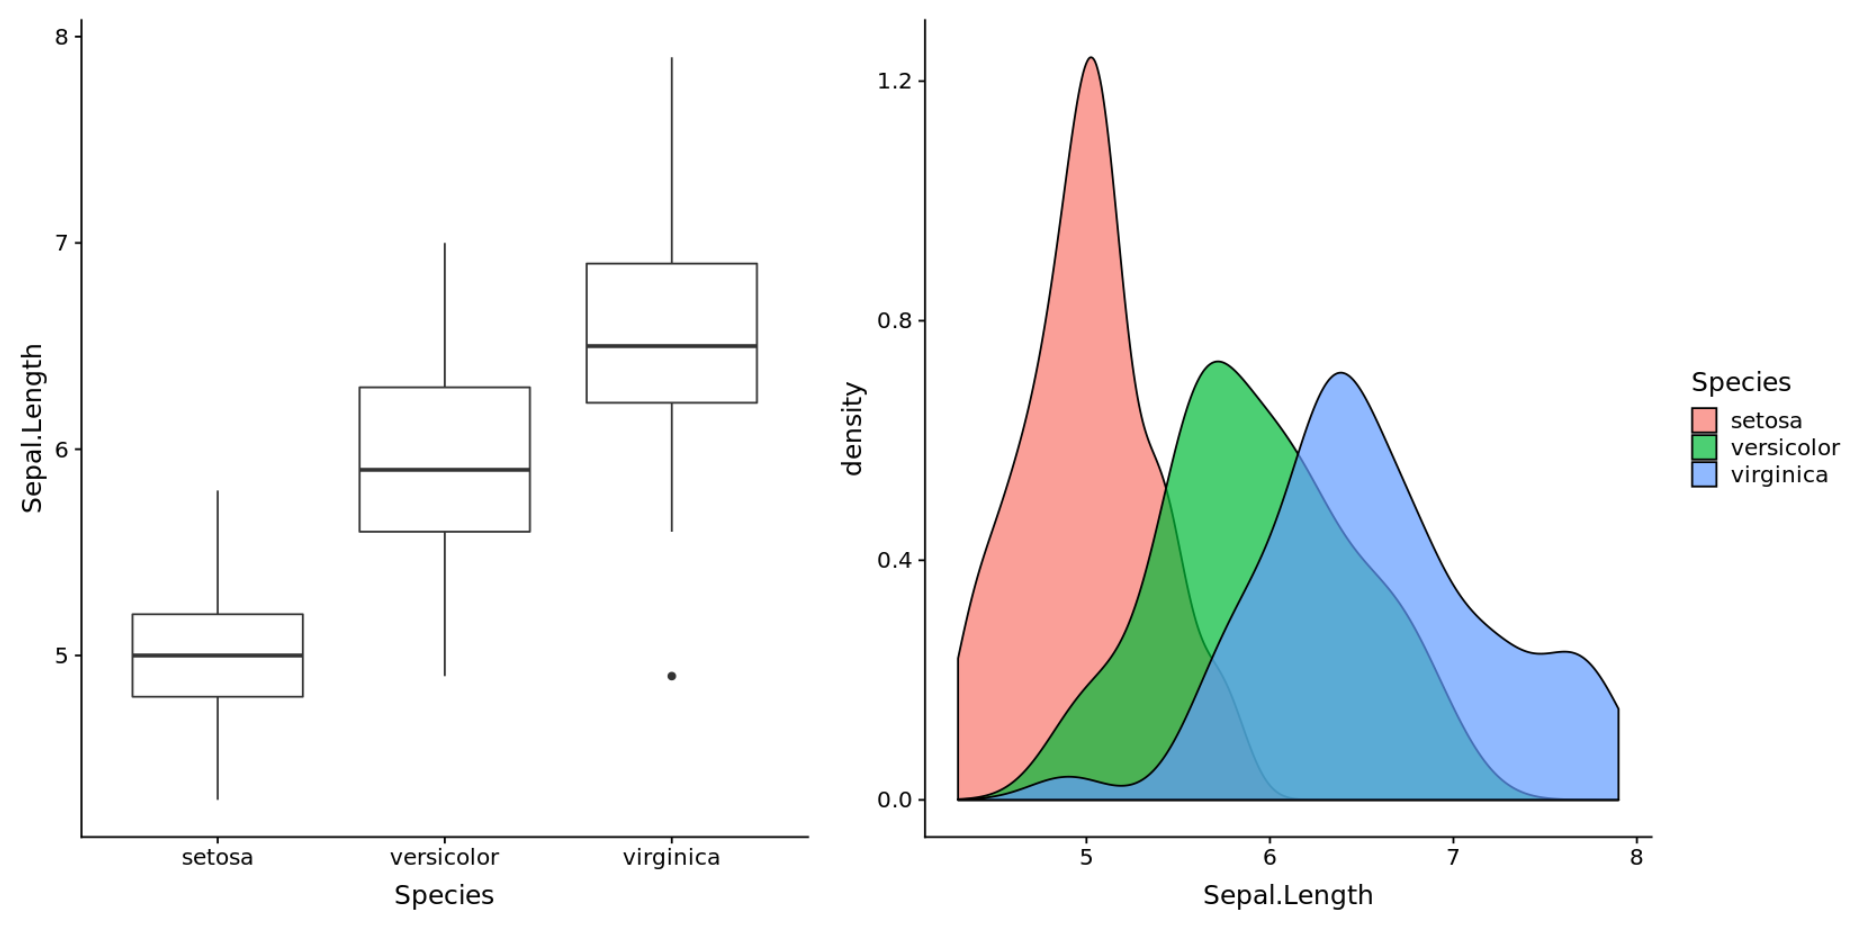
例 1: 2 つのプロットを並べて表示する
次のコードは、R の組み込みirisデータセットを使用して 2 つの並べてプロットを作成する方法を示しています。
 #create box plot
plot1 <- ggplot(iris, aes(x = Species, y = Sepal.Length)) +
  geom_boxplot()

#create density plot
plot2 <- ggplot(iris, aes(x = Sepal.Length, fill = Species)) +
  geom_density(alpha = 0.8)

#display plots side by side
plot1 + plot2
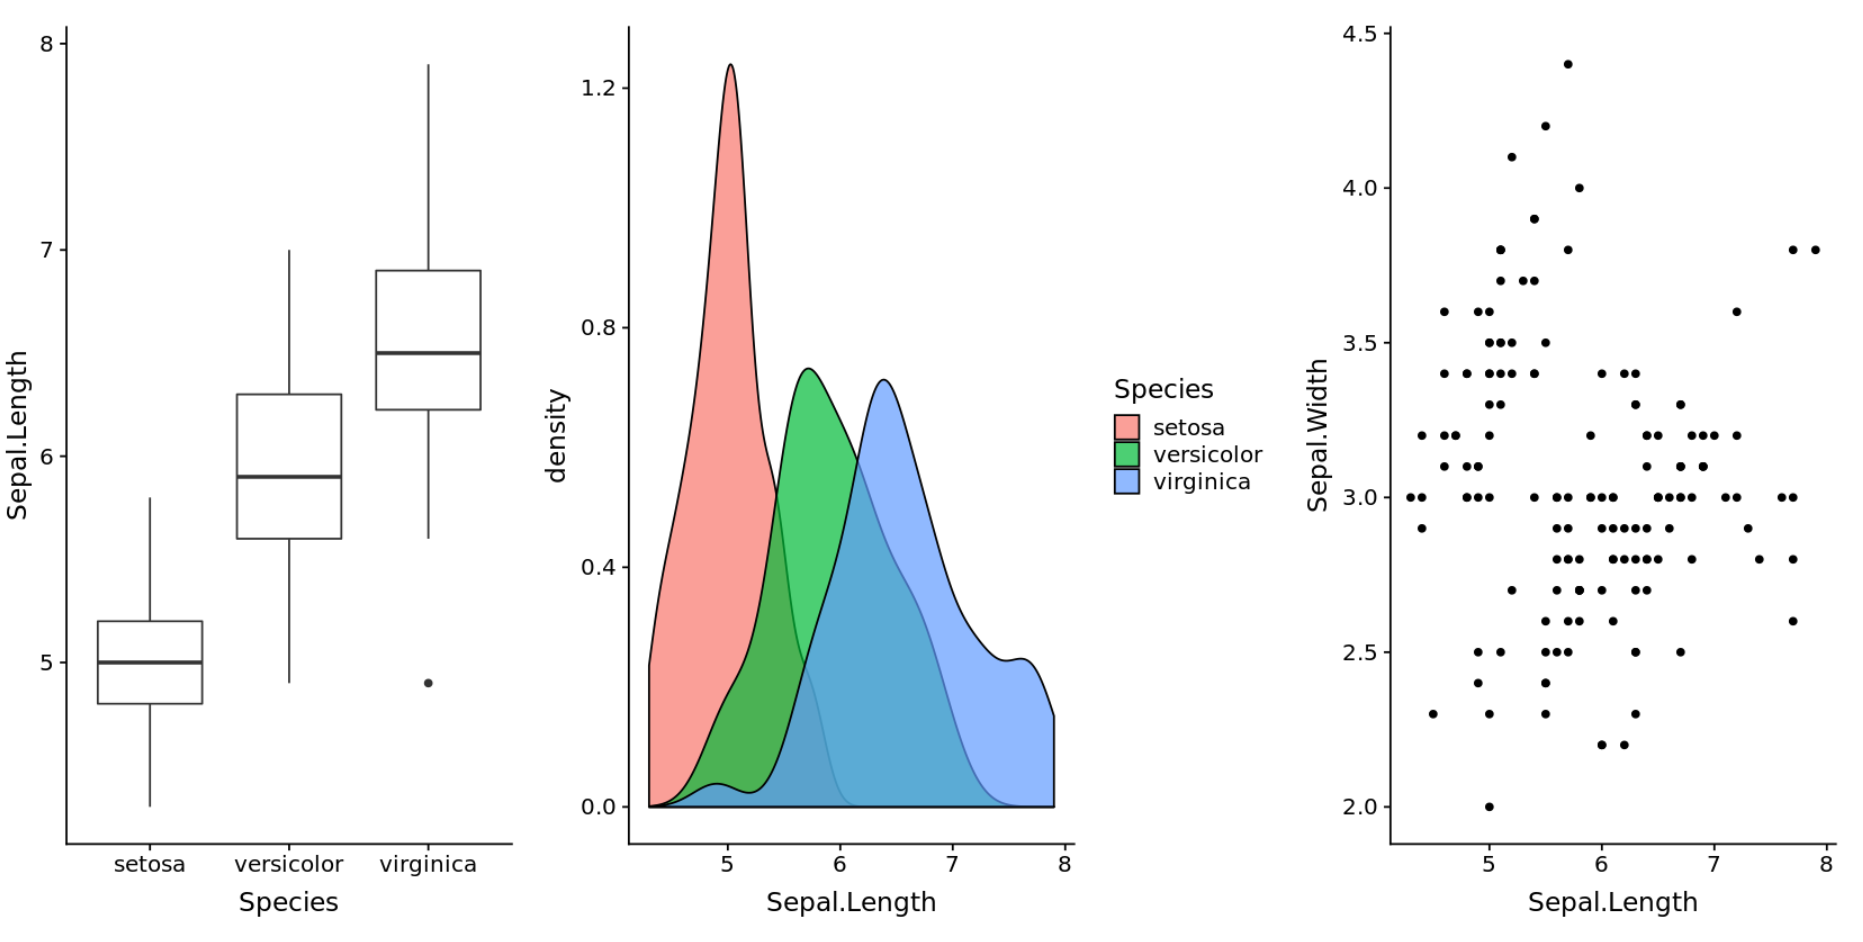
例 2: 3 つのプロットを並べて表示する
次のコードは、R の組み込みirisデータセットを使用して 3 つの並列プロットを作成する方法を示しています。
 #create box plot
plot1 <- ggplot(iris, aes(x = Species, y = Sepal.Length)) +
  geom_boxplot()

#create density plot
plot2 <- ggplot(iris, aes(x = Sepal.Length, fill = Species)) +
  geom_density(alpha = 0.7)

#create scatterplot
plot3 <- ggplot(iris, aes(x = Sepal.Length, y = Sepal.Width)) +
  geom_point()

#display three plots side by side
plot1 + plot2 + plot3
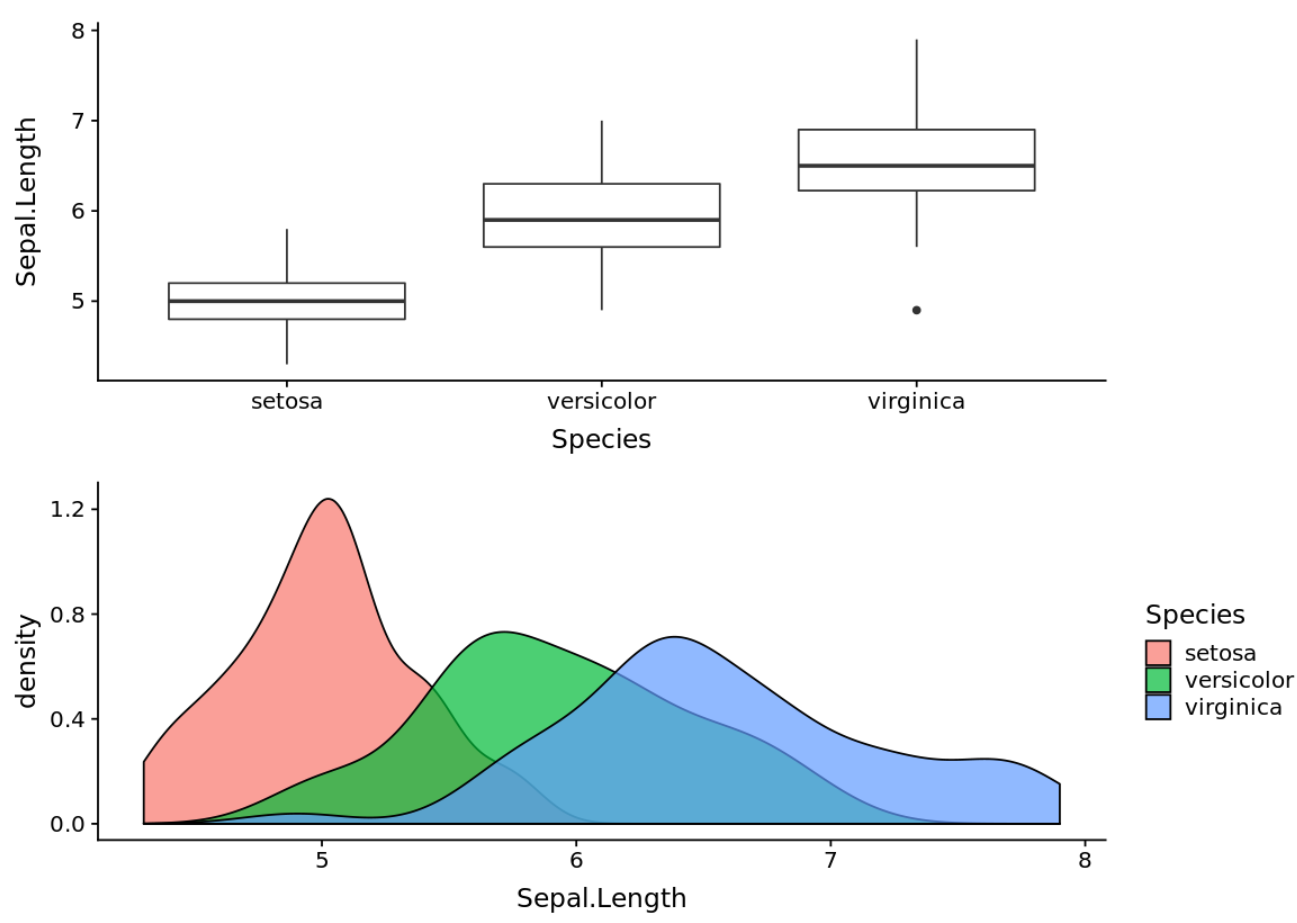
例 3: 2 つの積み上げプロット
次のコードは、2 つの積み上げプロットを上下に重ねて作成する方法を示しています。
 #create box plot
plot1 <- ggplot(iris, aes(x = Species, y = Sepal.Length)) +
  geom_boxplot()

#create density plot
plot2 <- ggplot(iris, aes(x = Sepal.Length, fill = Species)) +
  geom_density(alpha = 0.7)

#display plots stacked on top of each other
plot1 / plot2
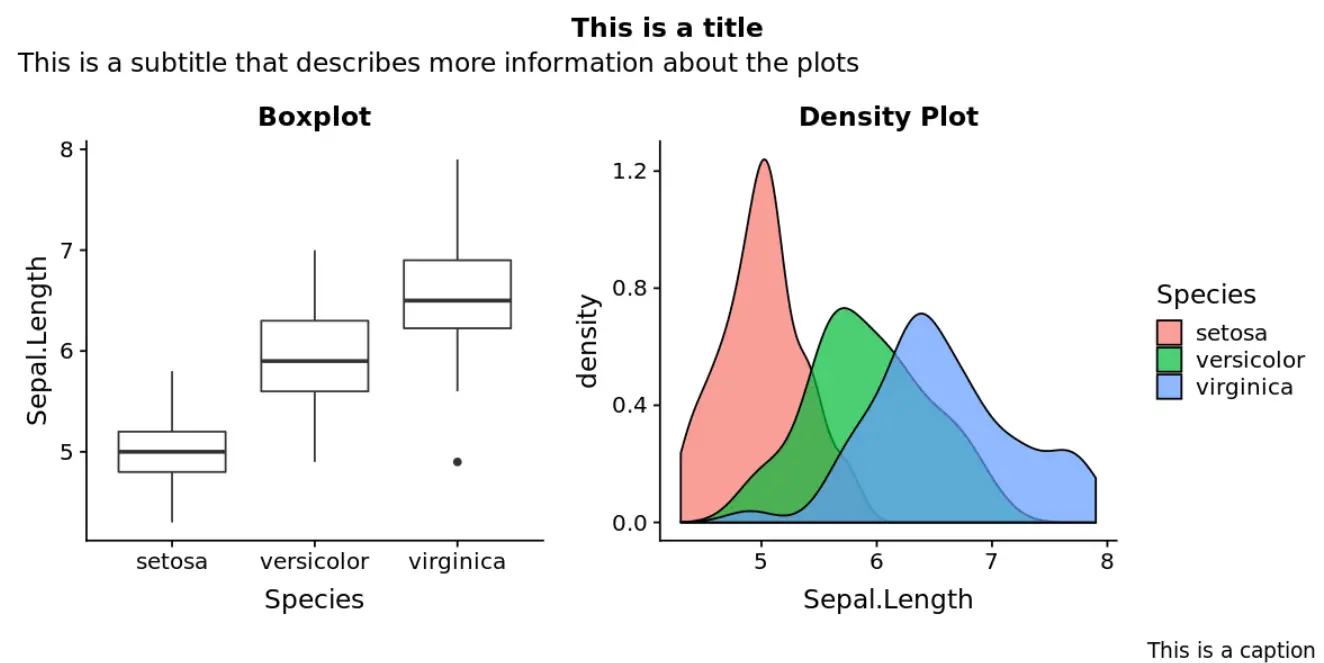
例 4: タイトル、サブタイトル、キャプションを追加する
次のコードは、プロットにタイトル、サブタイトル、キャプションを追加する方法を示しています。
 #create box plot
plot1 <- ggplot(iris, aes(x = Species, y = Sepal.Length)) +
  geom_boxplot() +
  ggtitle('Boxplot')

#create density plot
plot2 <- ggplot(iris, aes(x = Sepal.Length, fill = Species)) +
  geom_density(alpha = 0.7) +
  ggtitle('Density Plot')

#display plots side by side with title, subtitle, and captions
patchwork <- plot1 + plot2

patchwork + plot_annotation(
  title = ' This is a title ',
  subtitle = ' This is a subtitle that describes more information about the plots ',
  caption = ' This is a caption '
)
その他の R チュートリアルはここで見つけることができます。
著者について
ベンジャミン・アンダーソン博士
私はベンジャミンです。退職した統計教授から、専任の Statorials 教育者になりました。 統計分野における豊富な経験と専門知識を活かして、私は Statorials を通じて学生に力を与えるために自分の知識を共有することに尽力しています。もっと知る