Ggplot2凡例の項目の順序を変更する方法
次の構文を使用して、 ggplot2凡例の要素の順序を変更できます。
scale_fill_discrete(breaks=c('item4', 'item2', 'item1', 'item3', ...)
次の例は、この構文を実際に使用する方法を示しています。
例: ggplot2 凡例の要素の順序を変更する
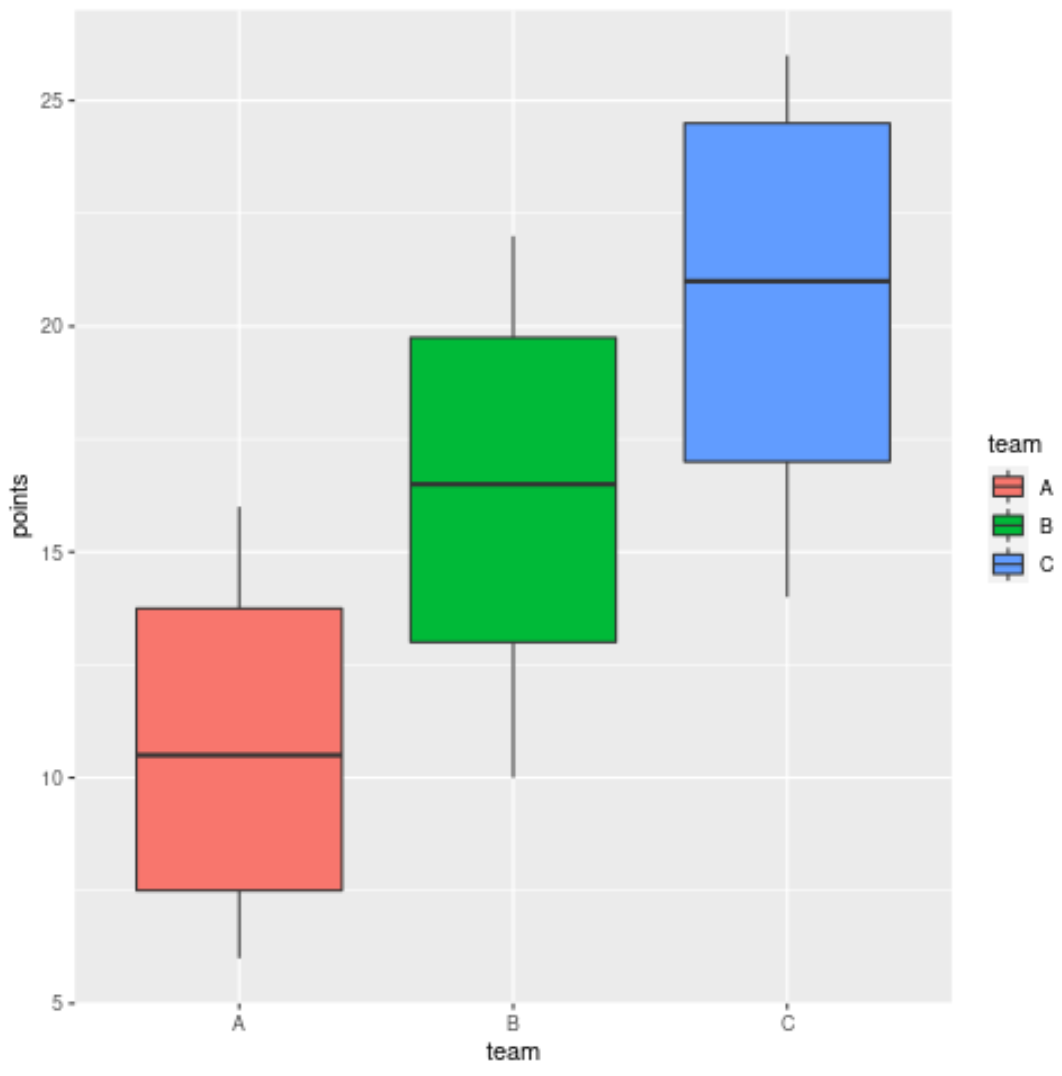
単一のプロットに複数の箱ひげ図を表示する次のプロットを ggplot2 で作成するとします。
 library (ggplot2)

#create data frame
df <- data. frame (team=c('A', 'A', 'A', 'A', 'B', 'B', 'B', 'B', 'C', 'C', 'C', 'VS'),
                 points=c(6, 8, 13, 16, 10, 14, 19, 22, 14, 18, 24, 26))

#create multiple boxplots to visualize points scored by team
ggplot(data=df, aes (x=team, y=points, fill=team)) +
  geom_boxplot()
凡例内の要素の順序を変更するには、次のようにscale_fill_discrete()関数を使用します。
 library (ggplot2)

#create data frame
df <- data. frame (team=c('A', 'A', 'A', 'A', 'B', 'B', 'B', 'B', 'C', 'C', 'C', 'VS'),
                 points=c(6, 8, 13, 16, 10, 14, 19, 22, 14, 18, 24, 26))

#create multiple boxplots to visualize points scored by team
ggplot(data=df, aes (x=team, y=points, fill=team)) +
  geom_boxplot() +
  scale_fill_discrete(breaks=c('B', 'C', 'A'))
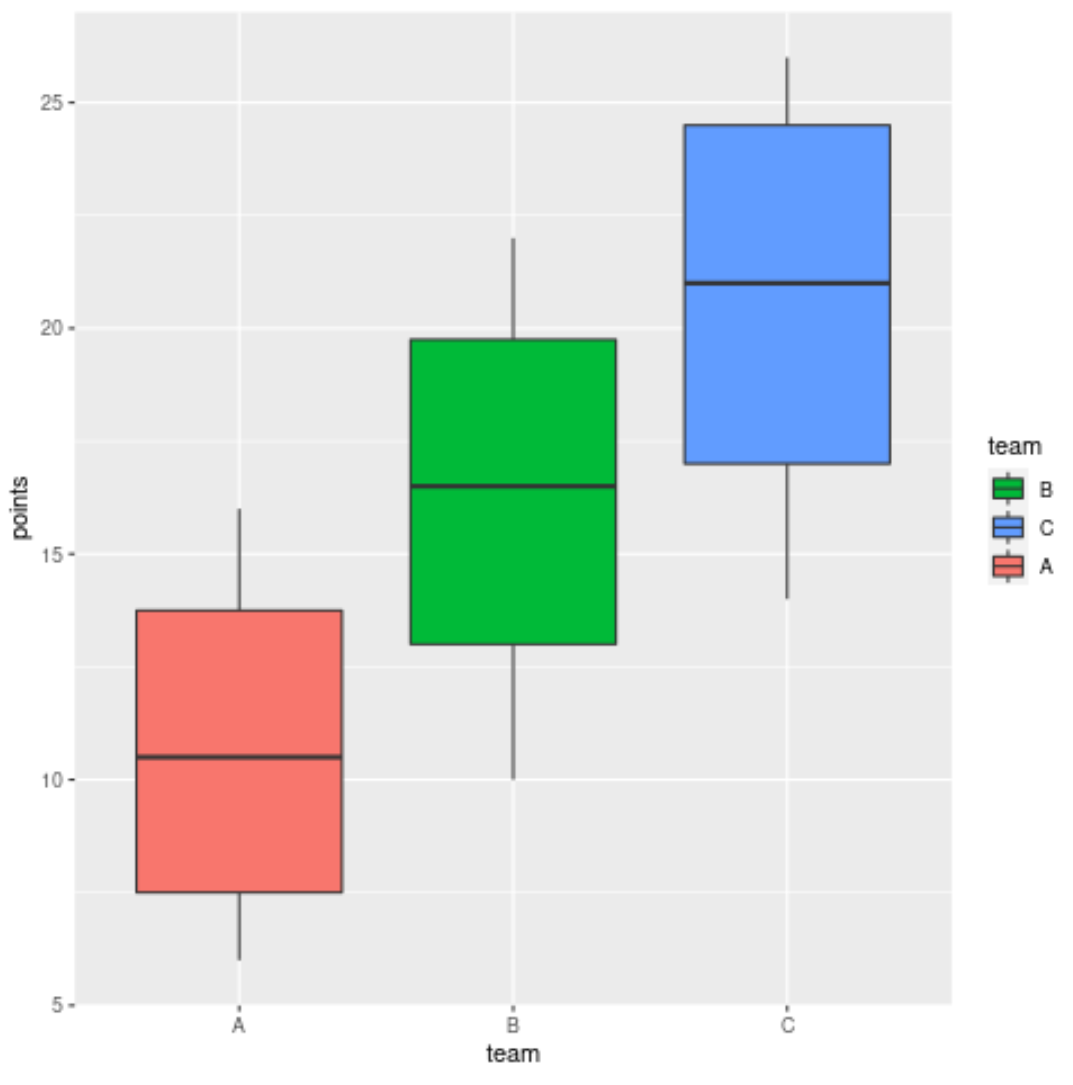
要素の順序が A、B、C から B、C、A に変更されていることに注意してください。
ラベル引数を使用して、凡例要素に使用される特定のラベルを変更することもできます。
 library (ggplot2)

#create data frame
df <- data. frame (team=c('A', 'A', 'A', 'A', 'B', 'B', 'B', 'B', 'C', 'C', 'C', 'VS'),
                 points=c(6, 8, 13, 16, 10, 14, 19, 22, 14, 18, 24, 26))

#create multiple boxplots to visualize points scored by team
ggplot(data=df, aes (x=team, y=points, fill=team)) +
  geom_boxplot() +
  scale_fill_discrete(breaks=c('B', 'C', 'A'),
                      labels=c('B Team', 'C Team', 'A Team'))
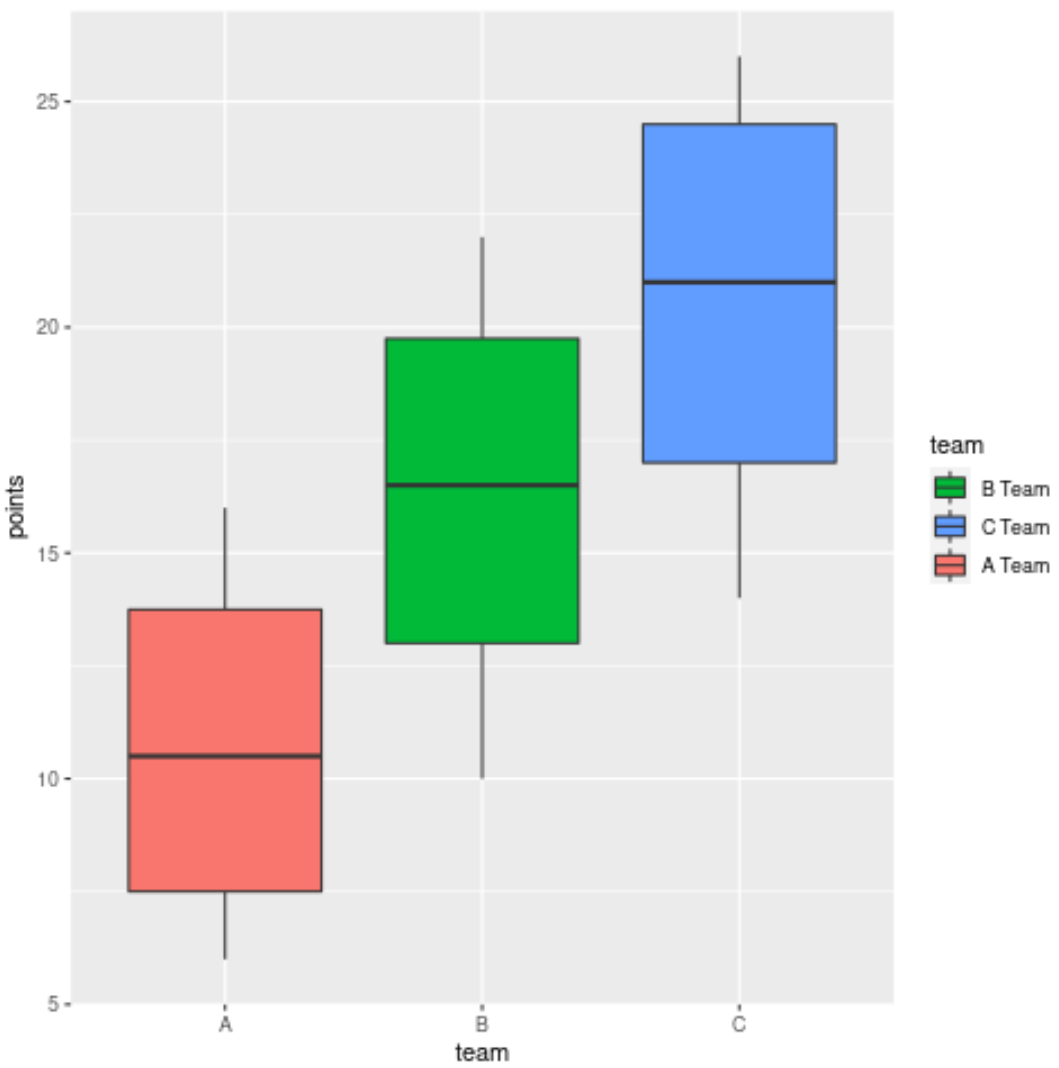
凡例のラベルが変更されていることに注意してください。
追加リソース
次のチュートリアルでは、ggplot2 で他の一般的な操作を実行する方法を説明します。
ggplot2で凡例を削除する方法
ggplot2で凡例の位置を変更する方法
ggplot2で凡例のサイズを変更する方法
ggplot2で凡例のタイトルを変更する方法
著者について
ベンジャミン・アンダーソン博士
私はベンジャミンです。退職した統計教授から、専任の Statorials 教育者になりました。 統計分野における豊富な経験と専門知識を活かして、私は Statorials を通じて学生に力を与えるために自分の知識を共有することに尽力しています。もっと知る