R で信頼区間をプロットする方法
信頼区間は、一定の信頼レベルで母集団パラメータが含まれる可能性が高い値の範囲です。
このチュートリアルでは、R でデータセットの信頼区間をプロットする方法について説明します。
例: R での信頼区間のプロット
R に 100 行 2 列の次のデータセットがあるとします。
 #make this example reproducible
set.seed(0)

#create dataset
x <- rnorm(100)
y <- x*2 + rnorm(100)
df <- data.frame(x = x, y = y)

#view first six rows of dataset
head(df)

           xy
1 1.2629543 3.3077678
2 -0.3262334 -1.4292433
3 1.3297993 2.0436086
4 1.2724293 2.5914389
5 0.4146414 -0.3011029
6 -1.5399500 -2.5031813
x と y の関係のグラフを作成するには、まず線形回帰モデルを近似します。
model <- lm(y ~ x, data = df)
次に、 abline()関数と Lines() 関数を使用して推定線形回帰直線のプロットを作成し、実際の信頼帯を作成します。
 #get predicted y values using regression equation
newx <- seq(min(df$x), max(df$x), length.out=100)
preds <- predict(model, newdata = data.frame(x=newx), interval = 'confidence')

#create plot of x vs. y, but don't display individual points (type='n')
plot(y ~ x, data = df, type = 'n')

#add fitted regression line
abline(model)

#add dashed lines for confidence bands
lines(newx, preds[,3], lty = 'dashed', col = 'blue')
lines(newx, preds[,2], lty = 'dashed', col = 'blue')
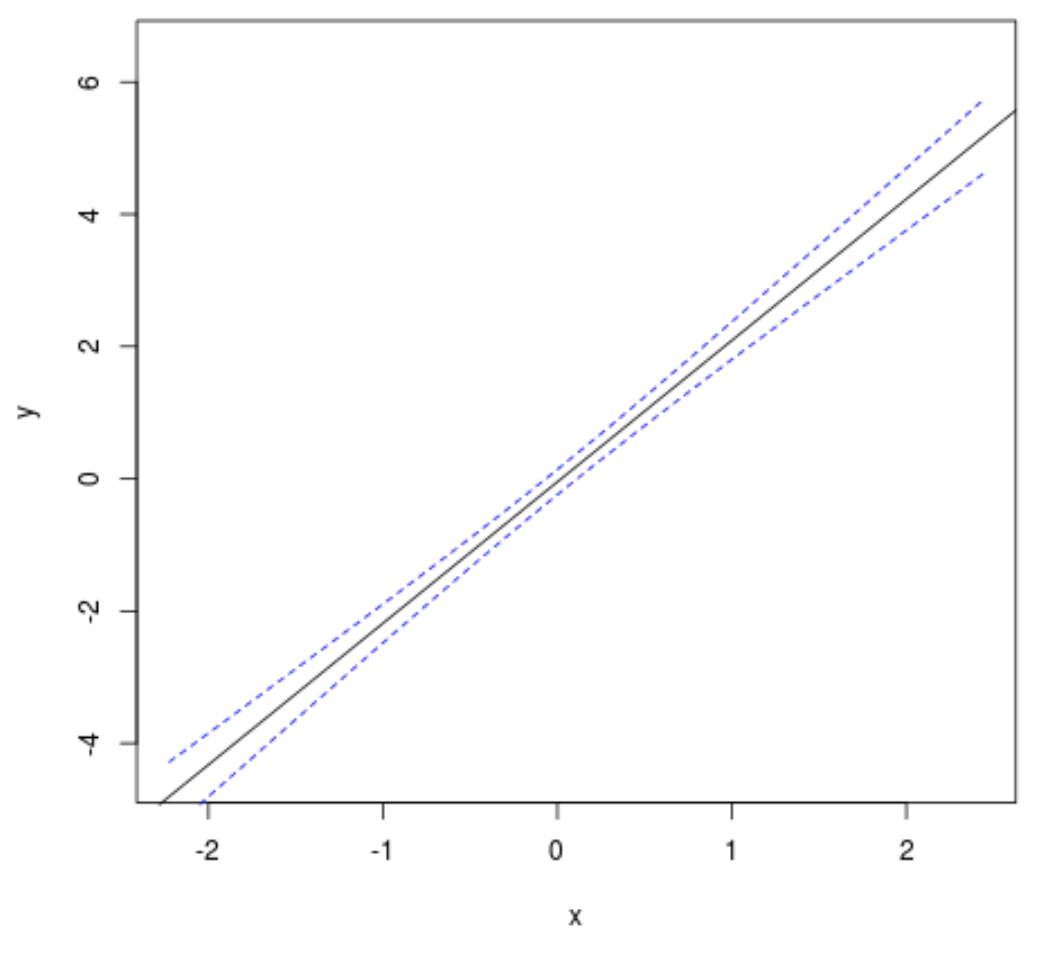
黒い線は近似された線形回帰直線を示し、2 つの青い破線は信頼区間を示します。
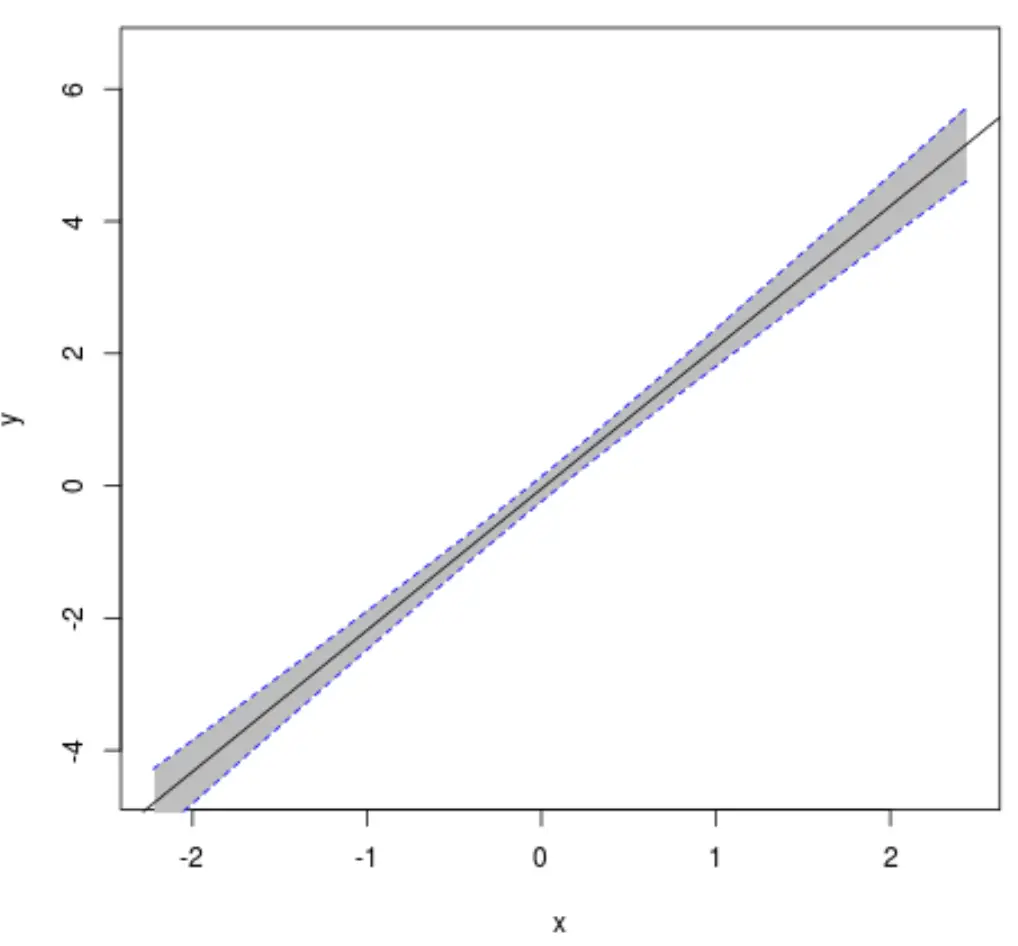
必要に応じて、次のコードを使用して、信頼区間の線と推定線形回帰直線の間の領域を埋めることもできます。
 #create plot of x vs. y
plot(y ~ x, data = df, type = 'n')

#fill in area between regression line and confidence interval
polygon(c(rev(newx), newx), c(rev(preds[,3]), preds[,2]), col = 'grey', border = NA)

#add fitted regression line
abline(model)

#add dashed lines for confidence bands
lines(newx, preds[,3], lty = 'dashed', col = 'blue')
lines(newx, preds[,2], lty = 'dashed', col = 'blue')
最初から最後までの完全なコードは次のとおりです。
 #make this example reproducible
set.seed(0)

#create dataset
x <- rnorm(100)
y <- x*2 + rnorm(100)
df <- data.frame(x = x, y = y)

#fit linear regression model
model <- lm(y ~ x, data = df)

#get predicted y values using regression equation
newx <- seq(min(df$x), max(df$x), length.out=100)
preds <- predict(model, newdata = data.frame(x=newx), interval = 'confidence')

#create plot of x vs. y
plot(y ~ x, data = df, type = 'n')

#fill in area between regression line and confidence interval
polygon(c(rev(newx), newx), c(rev(preds[,3]), preds[,2]), col = 'grey', border = NA)

#add fitted regression line
abline(model)

#add dashed lines for confidence bands
lines(newx, preds[,3], lty = 'dashed', col = 'blue')
lines(newx, preds[,2], lty = 'dashed', col = 'blue')
追加リソース
著者について
ベンジャミン・アンダーソン博士
私はベンジャミンです。退職した統計教授から、専任の Statorials 教育者になりました。 統計分野における豊富な経験と専門知識を活かして、私は Statorials を通じて学生に力を与えるために自分の知識を共有することに尽力しています。もっと知る