パンダ: dataframe の各列のヒストグラムを作成します。
次の基本構文を使用して、pandas DataFrame の各列のヒストグラムを作成できます。
 import pandas as pd
import matplotlib. pyplot as plt

#define number of subplots
fig, axis = plt. subplots (1, 3)

#create histogram for each column in DataFrame
df. hist (ax=axis)
この特定の例では、 subplots()関数を使用して DataFrame に3 つの列があることを指定し、各列のヒストグラムを作成します。
次の例は、この構文を実際に使用する方法を示しています。
例: Pandas ヒストグラムの各列のヒストグラムを作成する
3 つの列を含む次の pandas DataFrame があるとします。
 import pandas as pd
import numpy as np

#make this example reproducible
n.p. random . seeds (1)

#createDataFrame
df = pd. DataFrame ({' points ': np. random . normal (loc=20, scale=2, size=300),
                   ' assists ': np. random . normal (loc=14, scale=3, size=300),
                   ' rebounds ': np. random . normal (loc=12, scale=1, size=300)})

#view head of DataFrame
print ( df.head ())

      points assists rebounds
0 23.248691 20.197350 10.927036
1 18.776487 9.586529 12.495159
2 18.943656 11.509484 11.047938
3 17.854063 11.358267 11.481854
4 21.730815 13.162707 10.538596
次の構文を使用して、DataFrame の 3 つの列それぞれのヒストグラムを作成できます。
 import matplotlib. pyplot as plt

#define format for subplots (1 row and 3 columns)
fig, axis = plt. subplots (1, 3)

#create histogram for each column in DataFrame
df. hist (ax=axis)
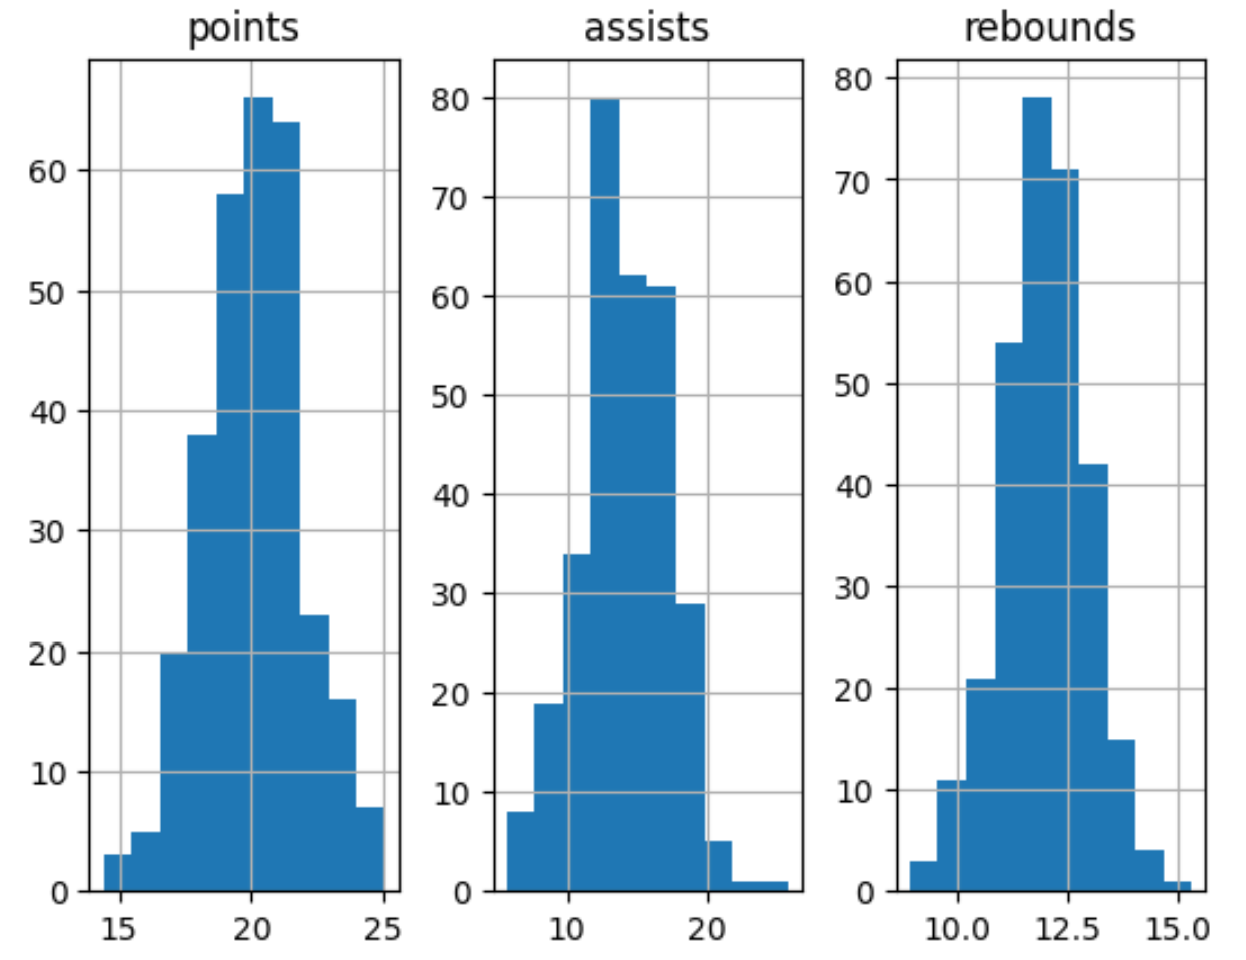
結果は、DataFrame の各列のヒストグラムを表示する 1 行 3 列のグリッドになります。
必要に応じて、 figsize引数を使用してヒストグラムのサイズを変更したり、 edgecolorおよびGrid引数を使用してヒストグラムの外観を改善したりできます。
 import matplotlib. pyplot as plt

#define format for subplots
fig, axis = plt. subplots (1, 3, figsize=(8,3))

#create histogram for each column in DataFrame
df. hist (ax=axis, edgecolor=' black ', grid= False )
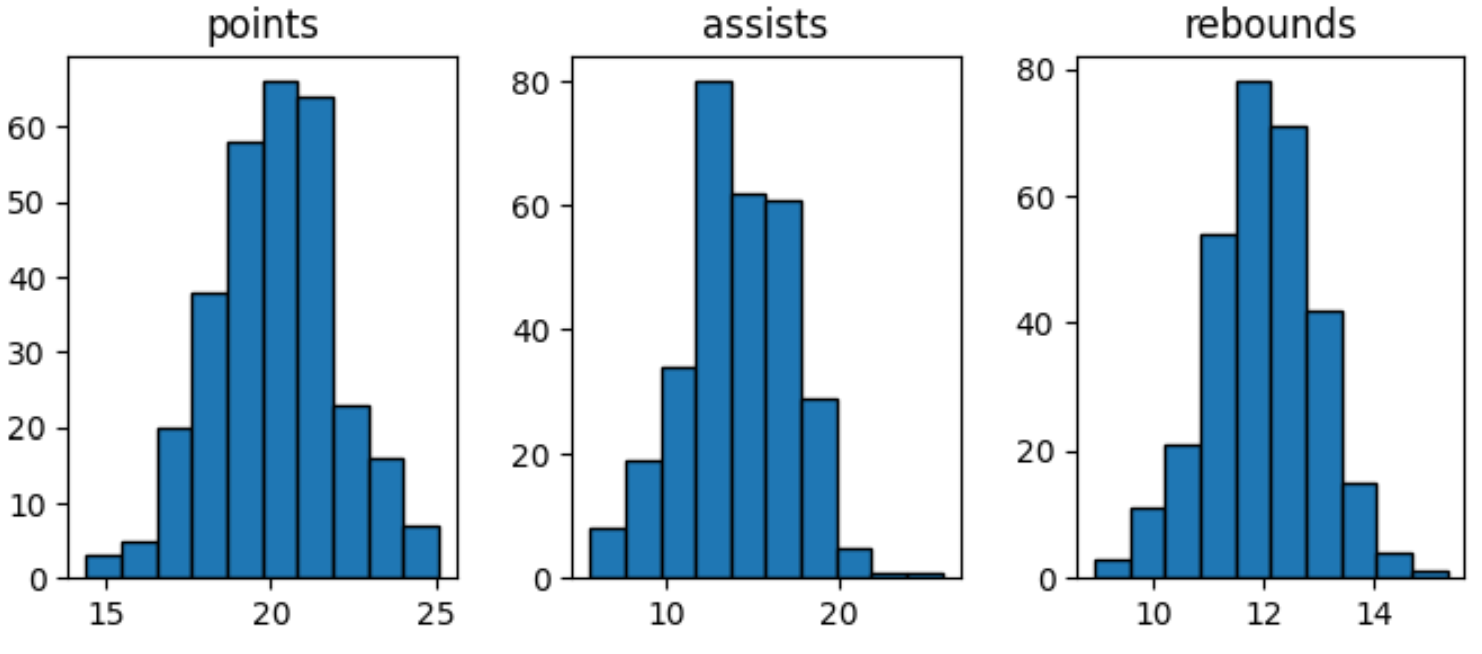
subplots()関数の引数を自由に操作して、ヒストグラムの正確な形式とサイズを定義してください。
追加リソース
次のチュートリアルでは、パンダで他の一般的なタスクを実行する方法を説明します。
Pandas ヒストグラムで使用されるビンの数を変更する方法
PandasヒストグラムのX軸の範囲を変更する方法
Pandas でグループごとにヒストグラムをプロットする方法
著者について
ベンジャミン・アンダーソン博士
私はベンジャミンです。退職した統計教授から、専任の Statorials 教育者になりました。 統計分野における豊富な経験と専門知識を活かして、私は Statorials を通じて学生に力を与えるために自分の知識を共有することに尽力しています。もっと知る