Matplotlib で fig.add_subplot を使用する方法
次の基本構文を使用して、Matplotlib でサブプロットを作成できます。
 import matplotlib. pyplot as plt

#define figure
fig = plt. figure ()

#add first subplot in layout that has 3 rows and 2 columns
fig. add_subplot (321)

#add fifth subplot in layout that has 3 rows and 2 columns
fig. add_subplot (325)

...
次の例は、この構文を実際に使用する方法を示しています。
例 1: 均一なレイアウトでサブプロットを追加する
次のコードは、3 行 2 列のレイアウトに 6 つのサブプロットを作成する方法を示しています。
 import matplotlib. pyplot as plt

#define figure
fig = plt. figure ()

#add subplots
fig. add_subplot (321). set_title (' 321 ')
fig. add_subplot (322). set_title (' 322 ')
fig. add_subplot (323). set_title (' 323 ')
fig. add_subplot (324). set_title (' 324 ')
fig. add_subplot (325). set_title (' 325 ')
fig. add_subplot (326). set_title (' 326 ')

#display plots
plt. show ()
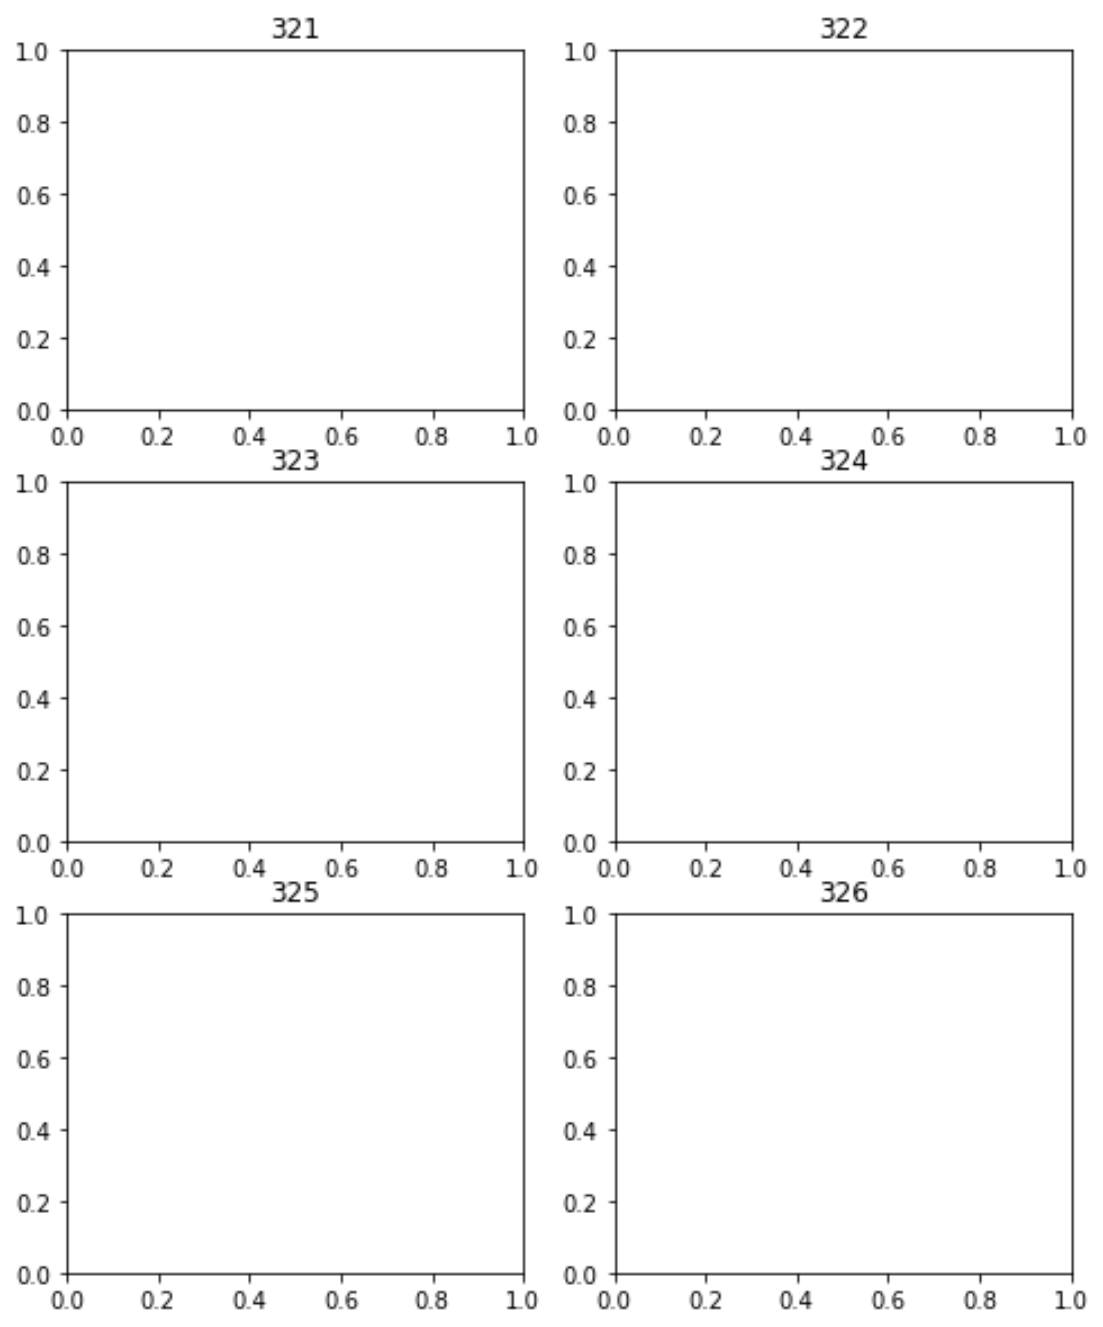
結果として、3 行 2 列のレイアウトで 6 つのサブプロットが表示されることに注意してください。
例 2: 不均一なレイアウトを持つサブプロットを追加する
次のコードは、次の 4 つのサブプロットを作成する方法を示しています。
- 3 つのプロットは 3 行 2 列のグリッドで作成されます。
- 4 番目のプロットは、1 行 2 列のグリッドで作成されます。
 import matplotlib. pyplot as plt

#define figure
fig = plt. figure ()

#add subplots
fig. add_subplot (321). set_title (' 321 ')
fig. add_subplot (323). set_title (' 323 ')
fig. add_subplot (325). set_title (' 325 ')
fig. add_subplot (122). set_title (' 122 ')

#display plots
plt. show ()
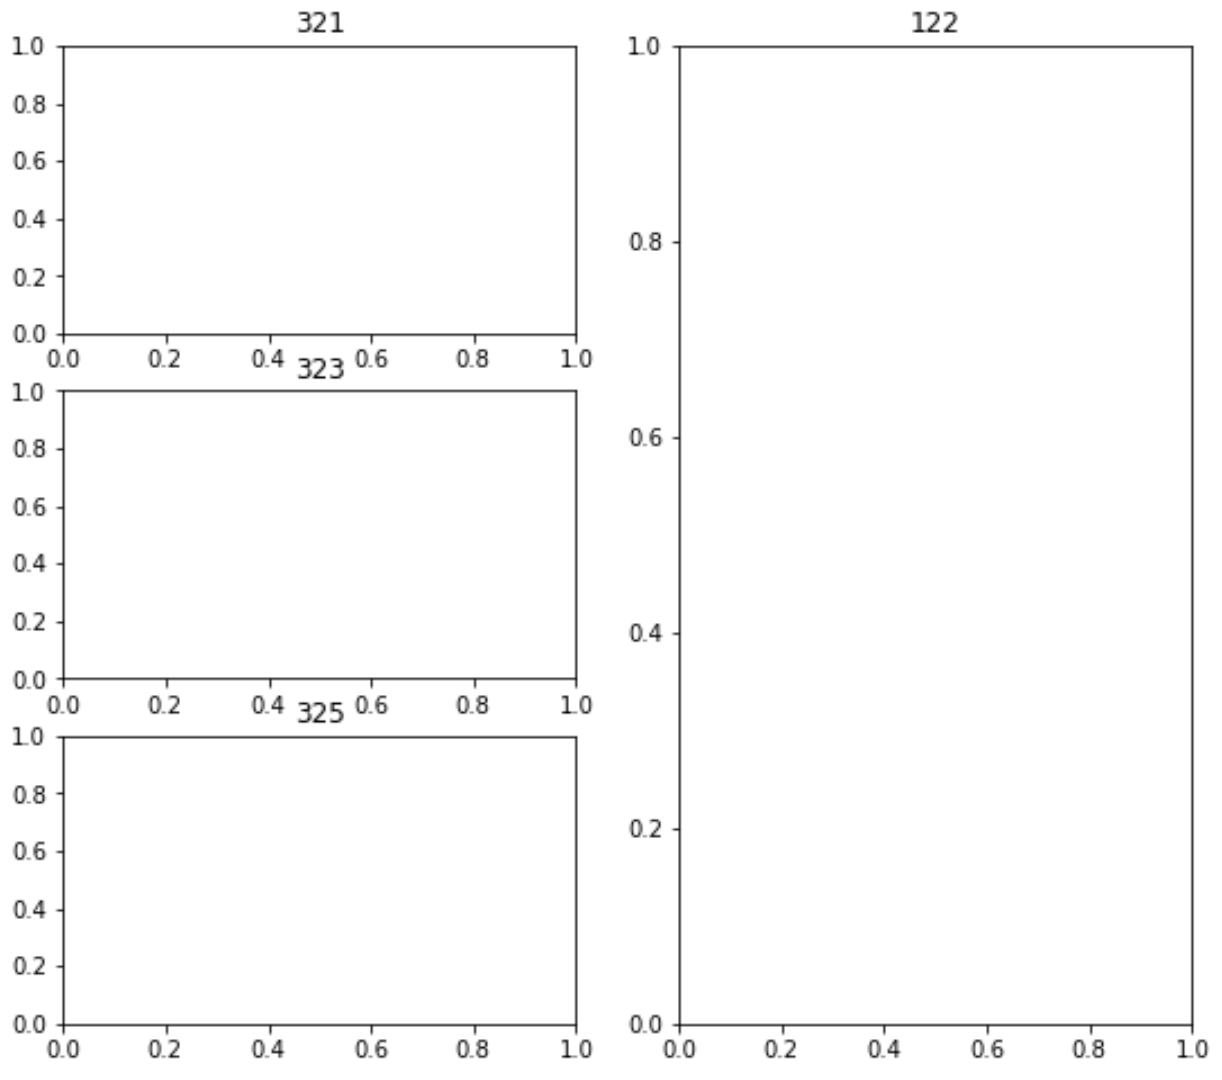
最終結果は、3 つのサブプロットが 3×2 グリッドに表示され、最後のサブプロットは 1×2 グリッドに表示されます。
追加リソース
次のチュートリアルでは、Matplotlib で他の一般的な操作を実行する方法を説明します。
Matplotlib サブプロット間の間隔を調整する方法
Matplotlib でサブプロット サイズを調整する方法
Matplotlib でサブプロットにタイトルを追加する方法
著者について
ベンジャミン・アンダーソン博士
私はベンジャミンです。退職した統計教授から、専任の Statorials 教育者になりました。 統計分野における豊富な経験と専門知識を活かして、私は Statorials を通じて学生に力を与えるために自分の知識を共有することに尽力しています。もっと知る