Ggplot2 で対数スケールを作成する方法
ggplot2 プロットの x 軸または y 軸のスケールを対数スケールに変換したい場合がよくあります。
ggplot2 のみを使用してこれを行うには、2 つの方法のいずれかを使用できます。
1.scale_y_continuous()またはscale_x_continuous()を使用します。
 ggplot(df, aes (x=x, y=y)) +
  geom_point() +
  scale_y_continuous(trans=' log10 ') +
  scale_x_continuous(trans=' log10 ')
2. 座標変換()を使用する
 ggplot(df, aes (x=x, y=y)) +
  geom_point() +
  coord_trans(y = ' log10 ' , x=' log10 ')
指数を表示するように軸ラベルをフォーマットしたい場合は、 scalesパッケージの関数を使用できます。
 ggplot(df, aes (x=x, y=y)) +
  geom_point() +
  scale_y_continuous(trans=' log10 ',
                     breaks= trans_breaks (' log10 ', function (x) 10^x),
                     labels= trans_format (' log10 ', math_format (10^.x)))
このチュートリアルでは、これらの関数を実際に使用する方法の例を示します。
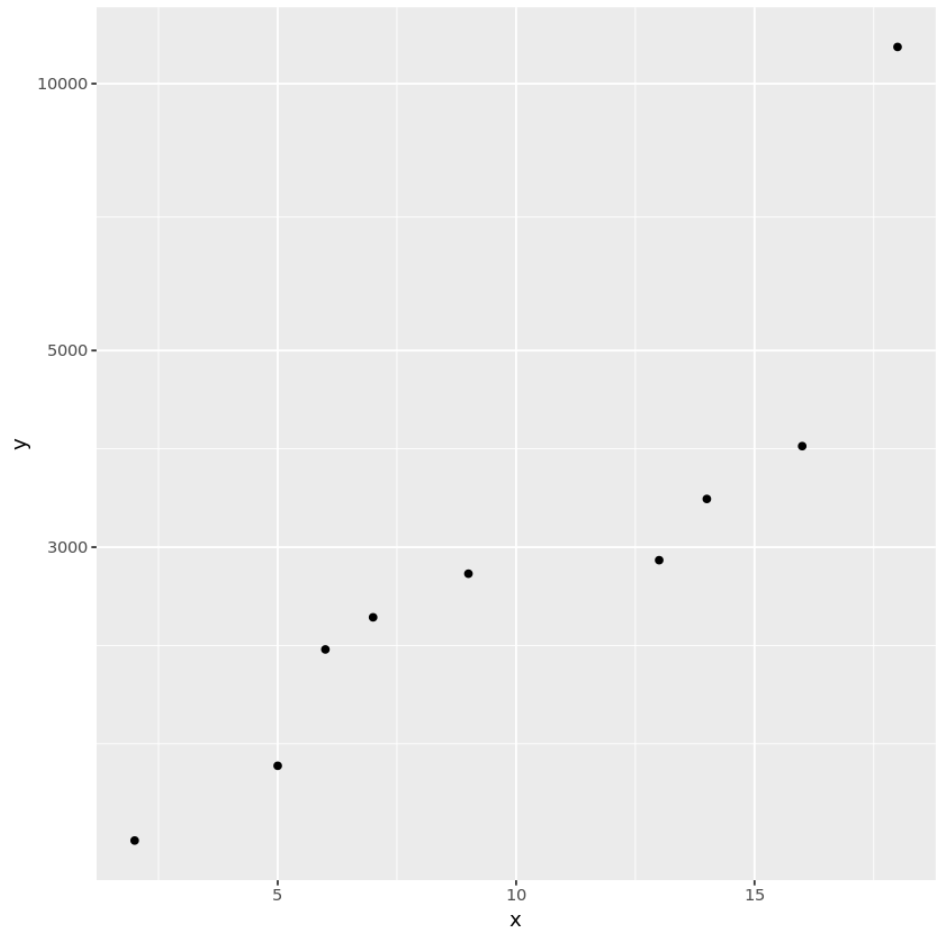
例 1:scale_y_continuous() を使用した対数スケール
次のコードは、 scale_y_continuous()関数を使用して、散布図の y 軸の対数スケールを作成する方法を示しています。
 library (ggplot2)

#create data frame
df <- data.frame(x=c(2, 5, 6, 7, 9, 13, 14, 16, 18),
                 y=c(1400, 1700, 2300, 2500, 2800, 2900, 3400, 3900, 11000))

#create scatterplot with log scale on y-axis
ggplot(df, aes (x=x, y=y)) +
  geom_point() +
  scale_y_continuous(trans=' log10 ')
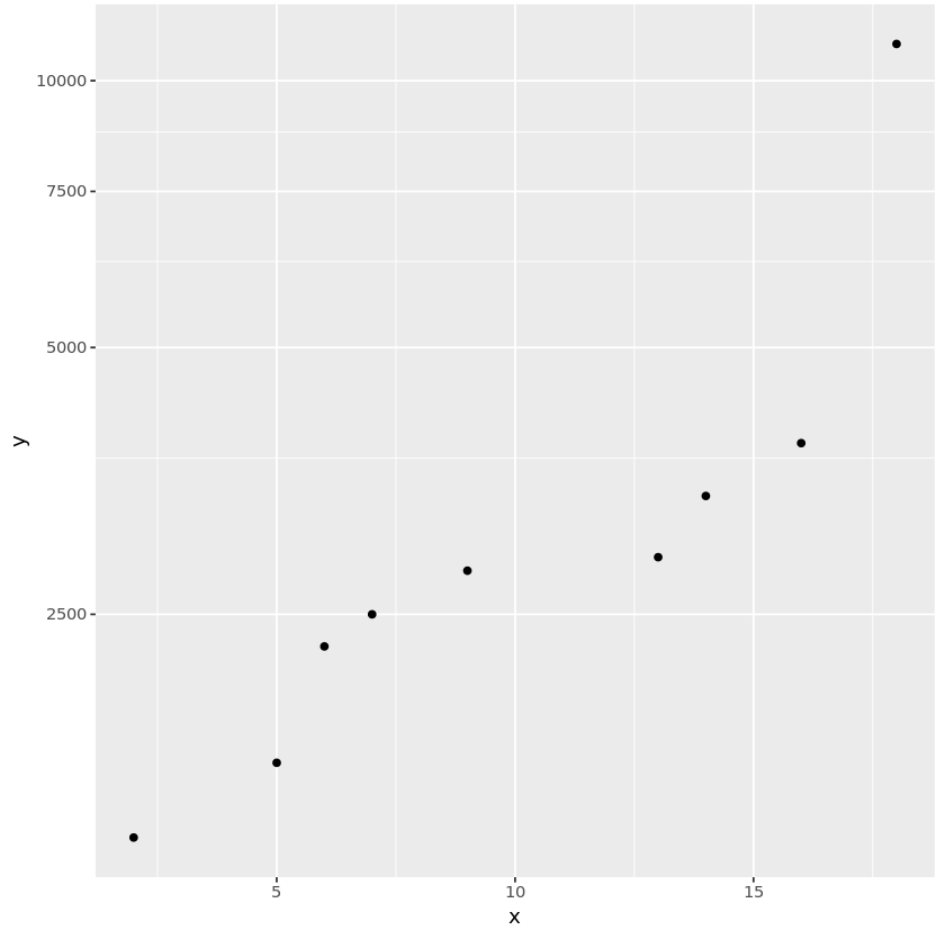
例 2: coord_trans() を使用した対数スケール
次のコードは、 coord_trans()関数を使用して、散布図の y 軸の対数スケールを作成する方法を示しています。
 library (ggplot2)

#create data frame
df <- data.frame(x=c(2, 5, 6, 7, 9, 13, 14, 16, 18),
                 y=c(1400, 1700, 2300, 2500, 2800, 2900, 3400, 3900, 11000))

#create scatterplot with log scale on y-axis
ggplot(df, aes (x=x, y=y)) +
  geom_point() +
  coord_trans(y=' log10 ')
例 3: カスタム対数スケール ラベル
次のコードは、 scalesパッケージの関数を使用して、散布図の y 軸の対数スケールを作成し、指数を含むカスタム ラベルを追加する方法を示しています。
 library (ggplot2)
library (scales)

#create data frame
df <- data.frame(x=c(2, 5, 6, 7, 9, 13, 14, 16, 18),
                 y=c(1400, 1700, 2300, 2500, 2800, 2900, 3400, 3900, 11000))

#create scatterplot with log scale on y-axis and custom labels
ggplot(df, aes (x=x, y=y)) +
  geom_point() +
  scale_y_continuous(trans=' log10 ',
                     breaks= trans_breaks (' log10 ', function (x) 10^x),
                     labels= trans_format (' log10 ', math_format (10^.x)))
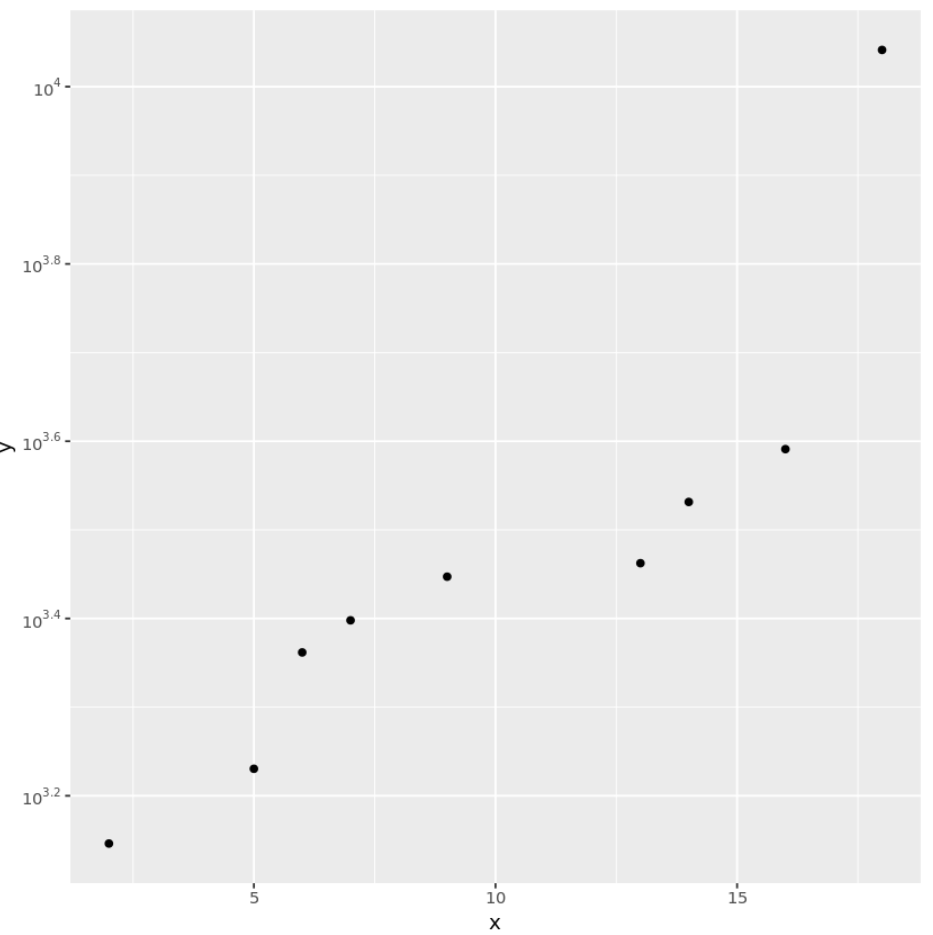
前の 2 つのプロットとは異なり、Y 軸のラベルには指数があることに注意してください。
追加リソース
ggplot2 タイトルの完全ガイド
最高の ggplot2 テーマの完全ガイド
ggplot2 で並列プロットを作成する方法
著者について
ベンジャミン・アンダーソン博士
私はベンジャミンです。退職した統計教授から、専任の Statorials 教育者になりました。 統計分野における豊富な経験と専門知識を活かして、私は Statorials を通じて学生に力を与えるために自分の知識を共有することに尽力しています。もっと知る