Python で最適な線を引く方法 (例付き)
次の基本構文を使用して、Python で最適な線を描画できます。
 #find line of best fit
a, b = np. polyfit (x, y, 1)

#add points to plot
plt. scatter (x,y)

#add line of best fit to plot
plt. plot (x, a*x+b)
次の例は、この構文を実際に使用する方法を示しています。
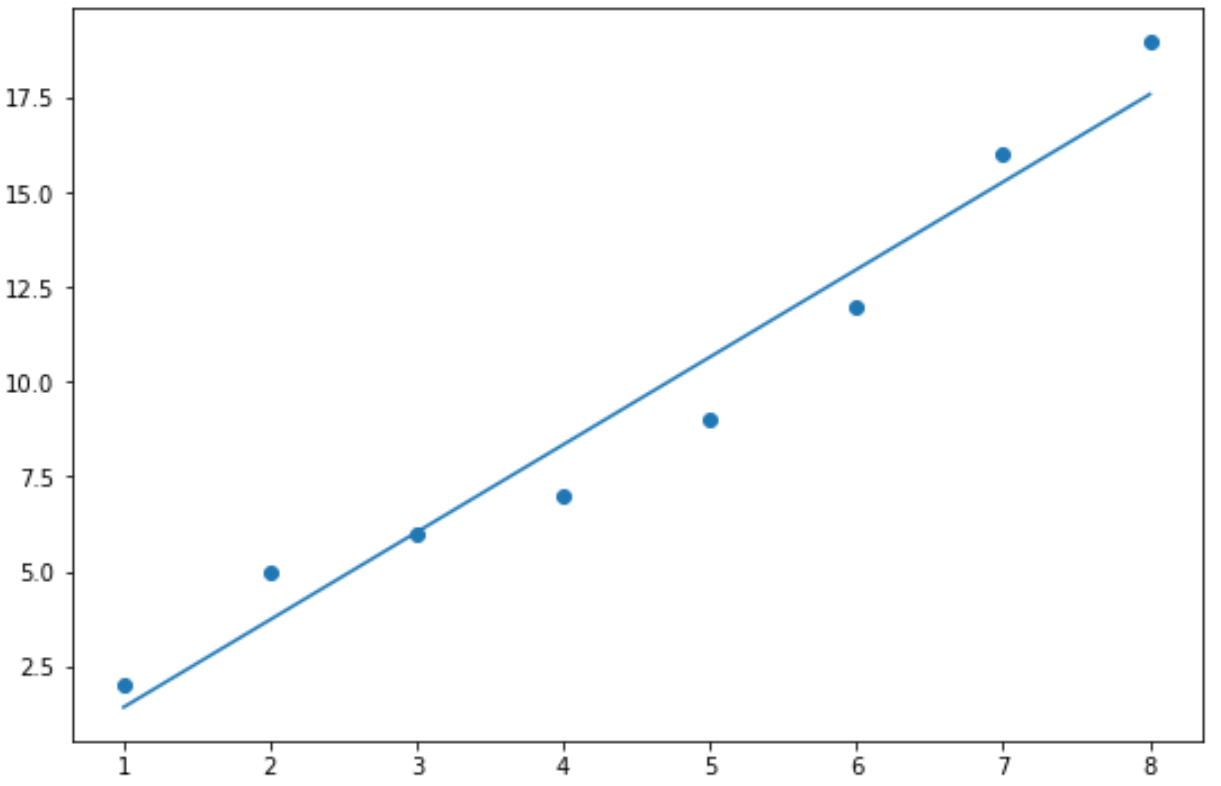
例 1: Python での最適なベースラインのプロット
次のコードは、Python で最適なベースラインを描画する方法を示しています。
 import numpy as np
import matplotlib. pyplot as plt

#define data
x = np. array ([1, 2, 3, 4, 5, 6, 7, 8])
y = np. array ([2, 5, 6, 7, 9, 12, 16, 19])

#find line of best fit
a, b = np. polyfit (x, y, 1)

#add points to plot
plt. scatter (x,y)

#add line of best fit to plot
plt. plot (x, a*x+b)
例 2: Python で最適なカスタム ラインを描画する
次のコードは、前の例と同じ最適な線を作成する方法を示していますが、次の点が追加されています。
- 点と最適な線のカスタムカラー
- カスタムスタイルと幅で最適なラインを実現
- プロット上に表示される近似回帰直線の方程式
 import numpy as np
import matplotlib. pyplot as plt

#define data
x = np. array ([1, 2, 3, 4, 5, 6, 7, 8])
y = np. array ([2, 5, 6, 7, 9, 12, 16, 19])

#find line of best fit
a, b = np. polyfit (x, y, 1)

#add points to plot
plt. scatter (x,y,color=' purple ')

#add line of best fit to plot
plt. plot (x, a*x+b, color=' steelblue ', linestyle=' -- ', linewidth= 2 )

#add fitted regression equation to plot
plt. text (1, 17, 'y = ' + '{:.2f}'. format (b) + ' + {:.2f}'. format (a) + 'x', size= 14 )
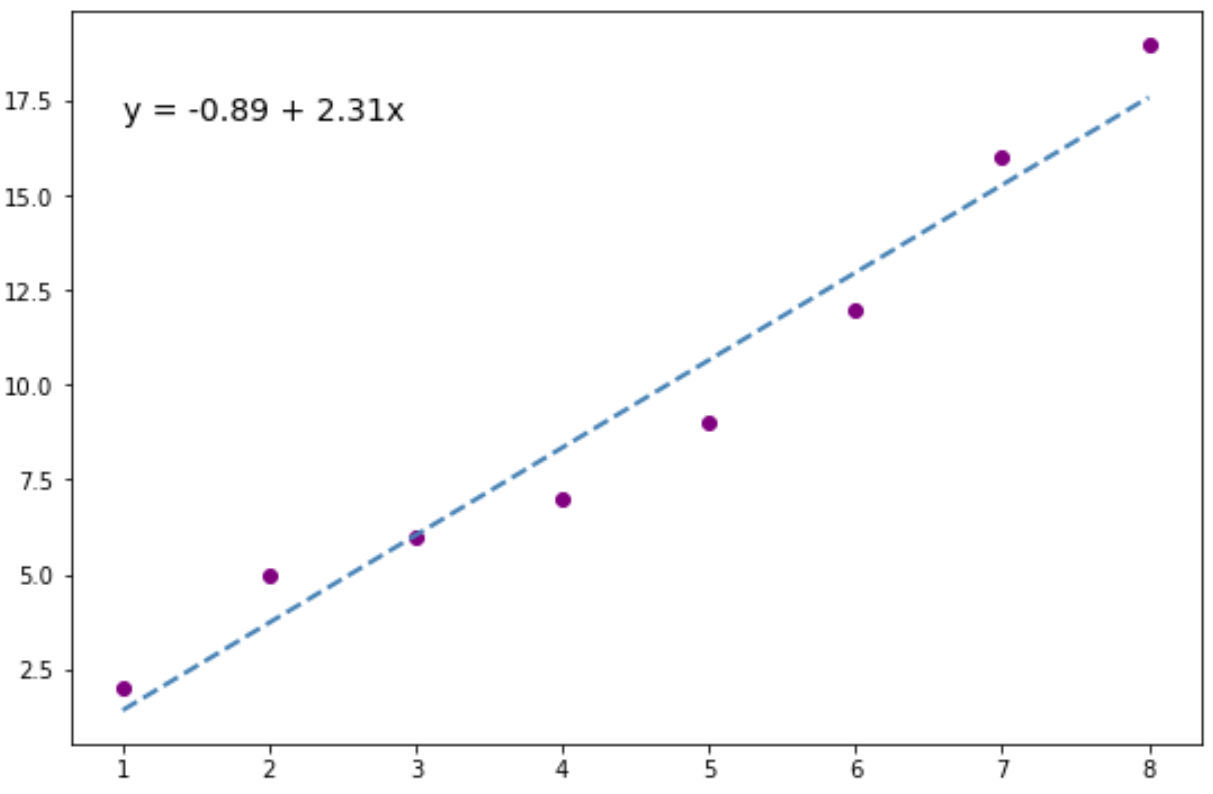
近似回帰式をプロット上の任意の(x,y)座標に自由に配置できます。
この特定の例では、(x, y) = (1, 17) を選択します。
追加リソース
次のチュートリアルでは、Python でさまざまな回帰モデルを適合する方法を説明します。
著者について
ベンジャミン・アンダーソン博士
私はベンジャミンです。退職した統計教授から、専任の Statorials 教育者になりました。 統計分野における豊富な経験と専門知識を活かして、私は Statorials を通じて学生に力を与えるために自分の知識を共有することに尽力しています。もっと知る