Seaborn プロットで対数スケールを使用する方法
plt.xscale()関数とplt.yscale()関数を使用すると、海洋プロットの x 軸と y 軸にそれぞれ対数スケールを使用できます。
 import matplotlib. pyplot as plt
import seaborn as sns

#create scatterplot with log scale on both axes
sns. scatterplot (data=df, x=' x ', y=' y ')
plt. xscale ('log')
plt. yscale ('log')
次の例は、これらの関数を実際に使用する方法を示しています。
例: Seaborn プロットでの対数スケールの使用
次のパンダ データフレームがあるとします。
 import pandas as pd

#createDataFrame
df = pd. DataFrame ({' x ': [2, 5, 6, 7, 9, 13, 14, 16, 18],
                   ' y ': [200, 1700, 2300, 2500, 2800, 2900, 3400, 3900, 11000]})

#view DataFrame
print (df)

    xy
0 2 200
1 5 1700
2 6 2300
3 7 2500
4 9 2800
5 13 2900
6 14 3400
7 16 3900
8 18 11000
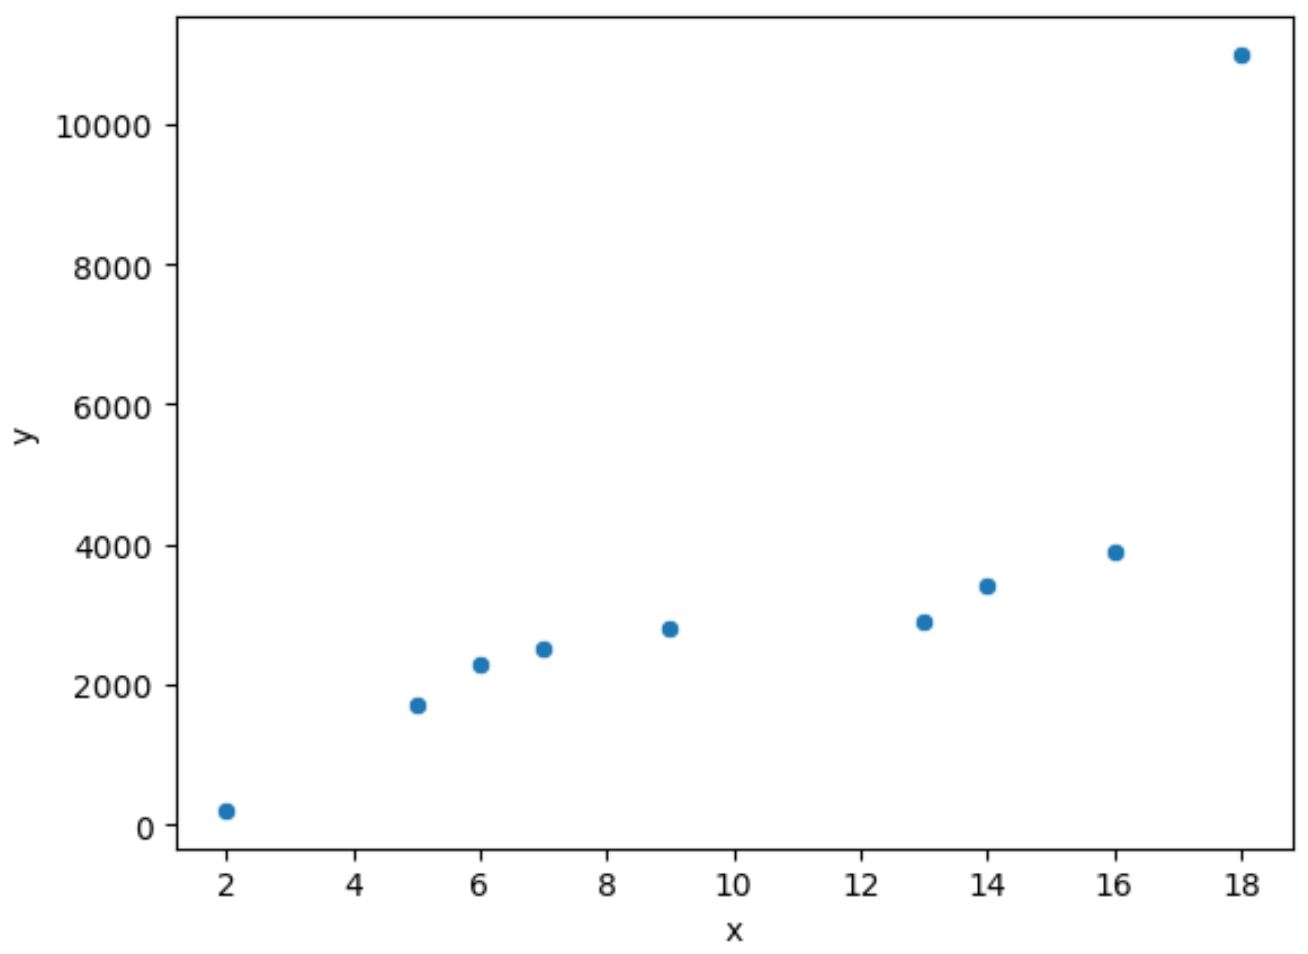
seaborn のscatterplot()関数を使用して、x軸とy軸の両方に線形スケールを使用する散布図を作成できます。
 import seaborn as sns

#create scatterplot with default axis scales
sns. scatterplot (data=df, x=' x ', y=' y ')
y 軸のみに対数スケールを使用するには、次の構文を使用できます。
 import matplotlib. pyplot as plt
import seaborn as sns

#create scatterplot with log scale on y-axis
sns. scatterplot (data=df, x=' x ', y=' y ')
plt. yscale ('log')
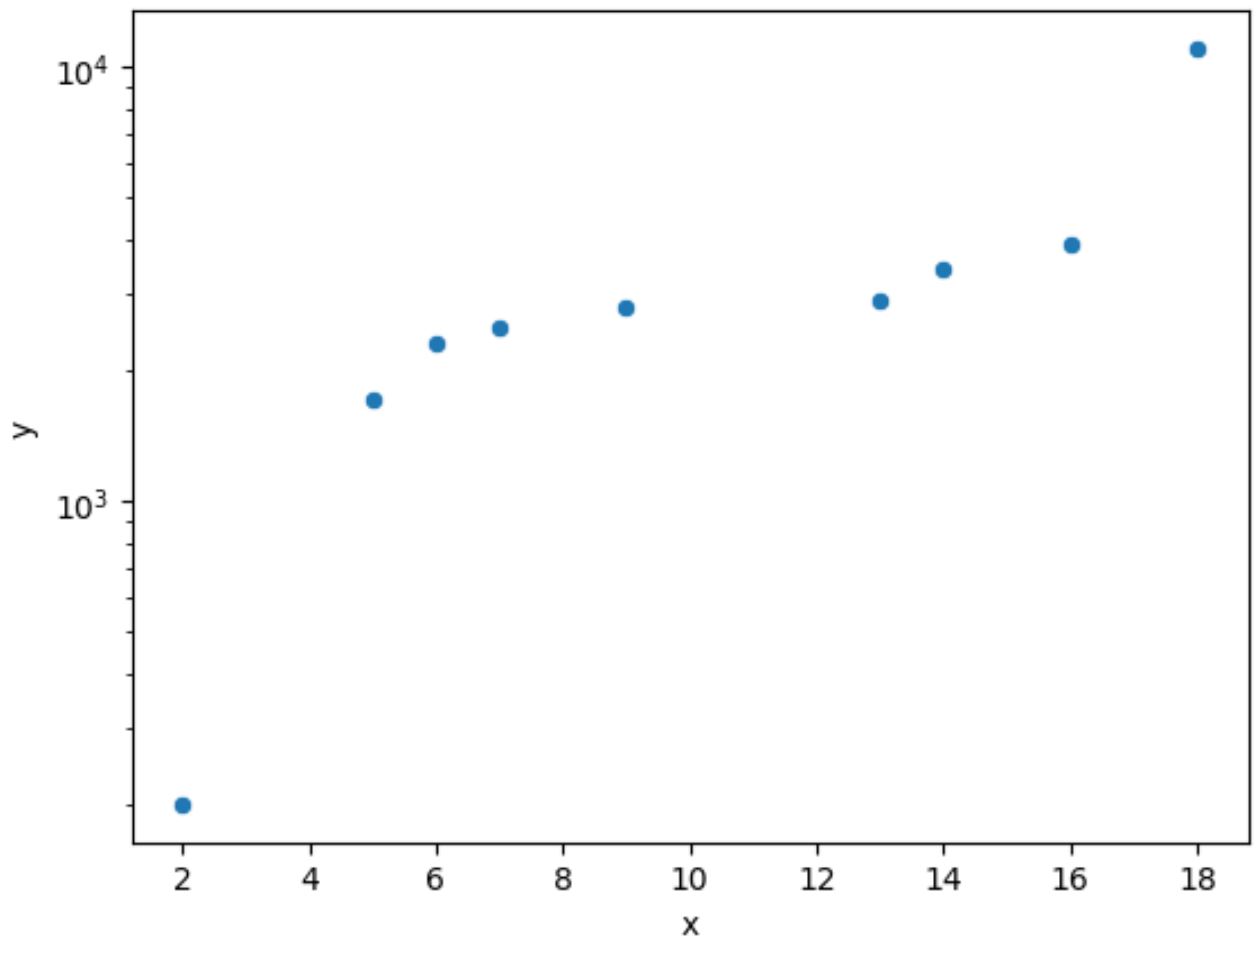
Y 軸には対数スケールが使用されることに注意してください。
次の場合は、X 軸に対数スケールを使用することもできます。
 import matplotlib. pyplot as plt
import seaborn as sns

#create scatterplot with log scale on both axes
sns. scatterplot (data=df, x=' x ', y=' y ')
plt. yscale (' log ')
plt. xscale (' log ')
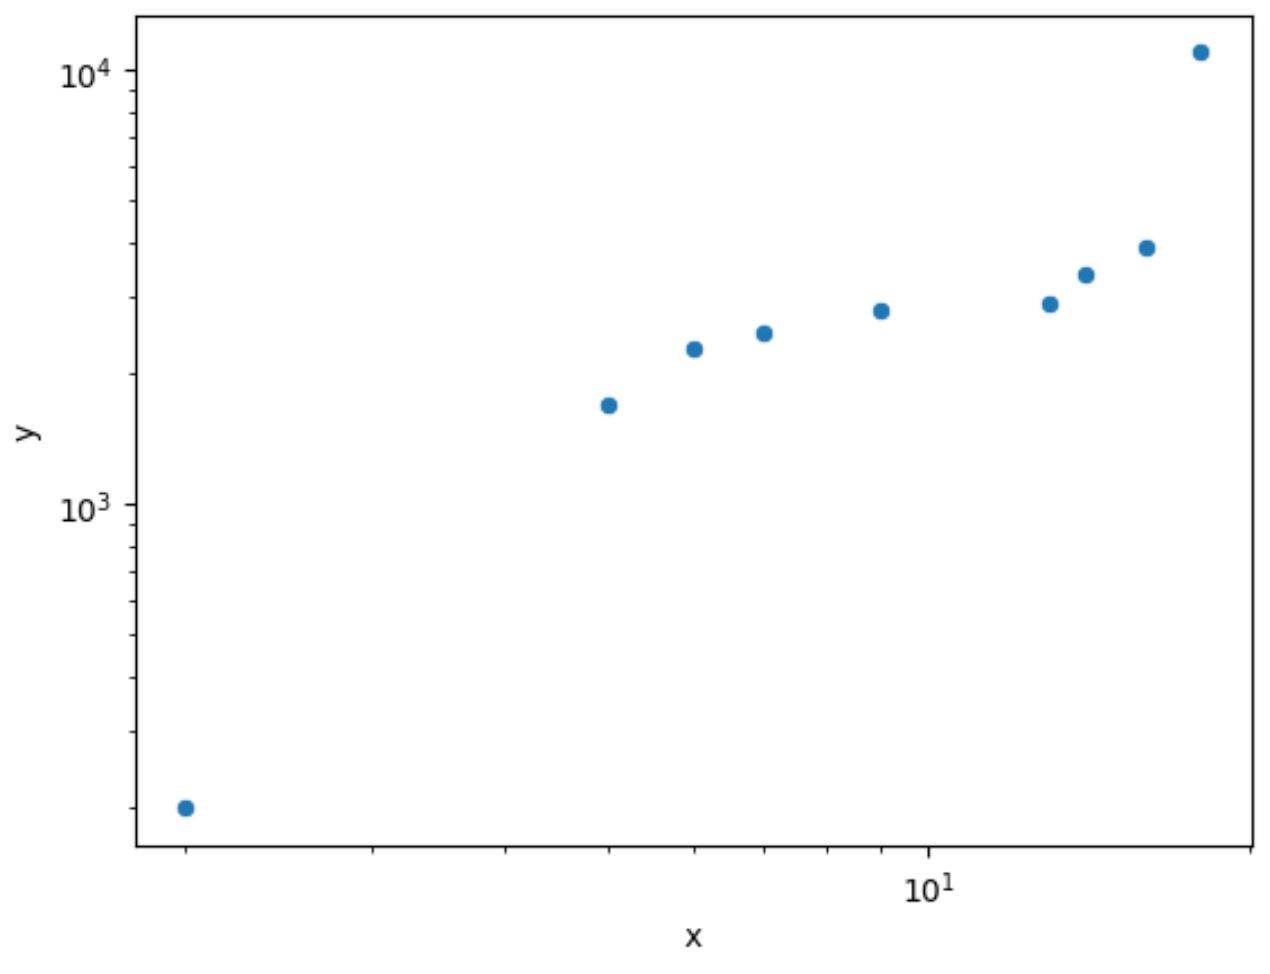
両方の軸で対数スケールが使用されることに注意してください。
関連: グラフで対数スケールを使用する必要があるのはどのような場合ですか?
追加リソース
次のチュートリアルでは、Seaborn で他の一般的なタスクを実行する方法を説明します。
Seaborn プロットにタイトルを追加する方法
Seaborn プロットで軸ラベルを回転する方法
Seaborn プロットの軸ラベルを変更する方法
著者について
ベンジャミン・アンダーソン博士
私はベンジャミンです。退職した統計教授から、専任の Statorials 教育者になりました。 統計分野における豊富な経験と専門知識を活かして、私は Statorials を通じて学生に力を与えるために自分の知識を共有することに尽力しています。もっと知る