Matplotlib で滑らかな曲線をプロットする方法
Matplotlib で折れ線グラフの滑らかな曲線をプロットしたい場合があります。幸いなことに、これは次の SciPy 関数を使用して簡単に行うことができます。
このチュートリアルでは、これらの機能を実際に使用する方法を説明します。
例: Matplotlib で滑らかな曲線をプロットする
次のコードは、一連のデータに対して単純な折れ線グラフを作成する方法を示しています。
 import numpy as np
import matplotlib.pyplot as plt

#create data
x = np.array([1, 2, 3, 4, 5, 6, 7, 8])
y = np.array([4, 9, 12, 30, 45, 88, 140, 230])

#create line chart
plt. plot (x,y)
plt. show ()
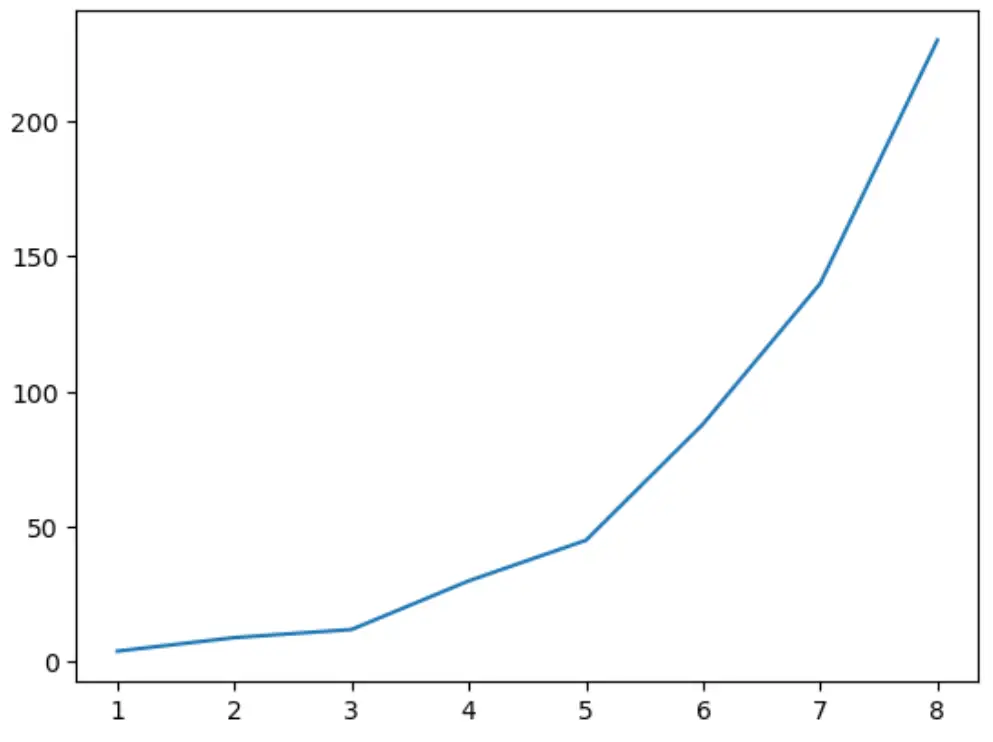
基になるデータが滑らかな線に従っていないため、折れ線グラフは完全に滑らかではないことに注意してください。次のコードを使用して、このデータセットの滑らかな曲線を作成できます。
 from scipy.interpolate import make_interp_spline, BSpline

#createdata
x = np.array([1, 2, 3, 4, 5, 6, 7, 8])
y = np.array([4, 9, 12, 30, 45, 88, 140, 230])

#define x as 200 equally spaced values between the min and max of original x
xnew = np. linspace ( x.min (), x.max (), 200 )

#define spline
spl = make_interp_spline (x, y, k= 3 )
y_smooth = spl (xnew)

#create smooth line chart
plt. plot (xnew, y_smooth)
plt. show ()
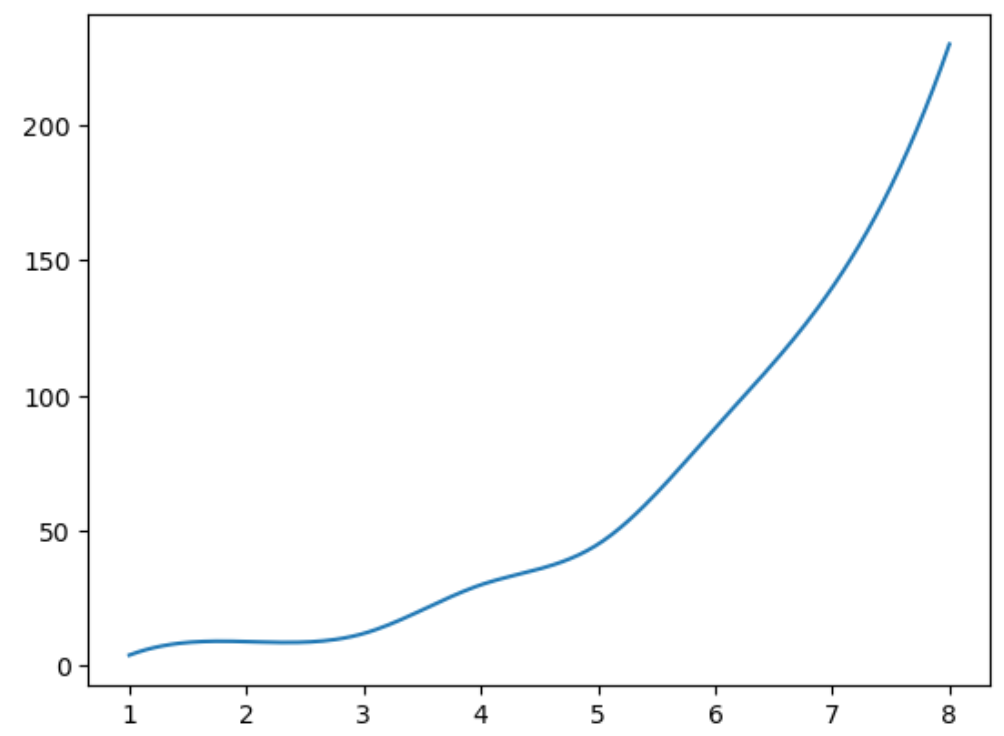
k引数に使用する次数が高くなるほど、曲線の「波打ち」が大きくなることに注意してください。たとえば、 k=7の次のグラフを考えてみましょう。
 from scipy.interpolate import make_interp_spline, BSpline

#createdata
x = np.array([1, 2, 3, 4, 5, 6, 7, 8])
y = np.array([4, 9, 12, 30, 45, 88, 140, 230])

#define x as 200 equally spaced values between the min and max of original x
xnew = np. linspace ( x.min (), x.max (), 200 )

#define spline with degree k=7
spl = make_interp_spline (x, y, k= 7 )
y_smooth = spl (xnew)

#create smooth line chart
plt. plot (xnew, y_smooth)
plt. show ()
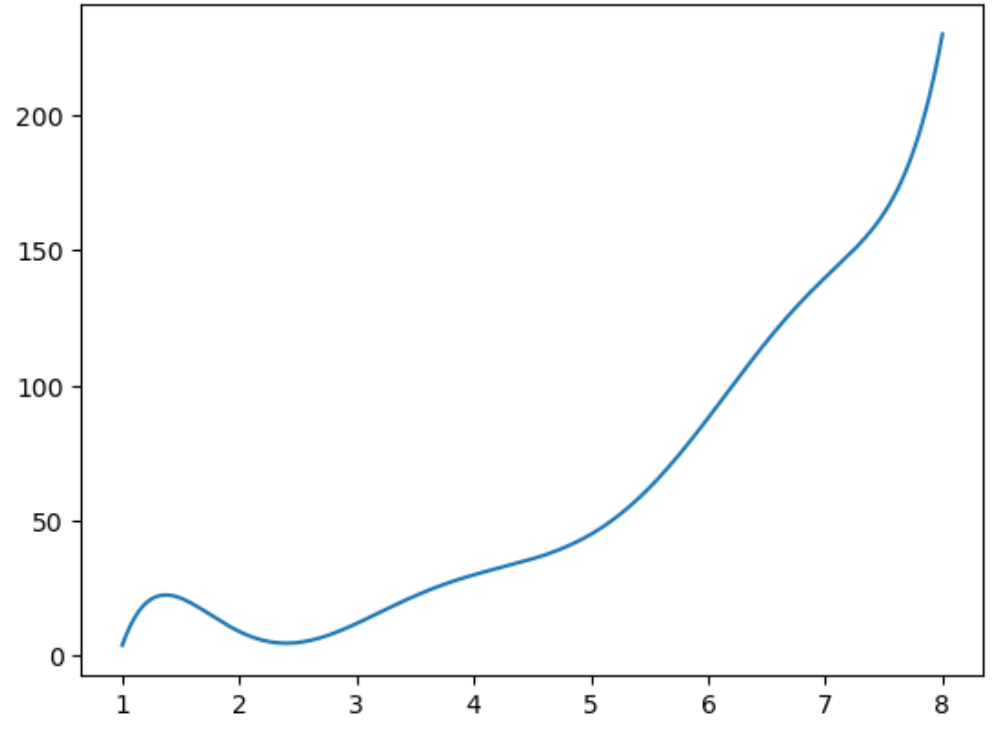
線の曲率に応じて、k の値を変更できます。
追加リソース
Matplotlib プロットにグリッド線を表示する方法
Matplotlib プロットから目盛を削除する方法
対数スケールを使用して Matplotlib プロットを作成する方法
著者について
ベンジャミン・アンダーソン博士
私はベンジャミンです。退職した統計教授から、専任の Statorials 教育者になりました。 統計分野における豊富な経験と専門知識を活かして、私は Statorials を通じて学生に力を与えるために自分の知識を共有することに尽力しています。もっと知る