Pandas で移動平均を計算する方法
移動平均は、時系列における以前のいくつかの期間の単純な平均です。
pandas DataFrame 内の 1 つ以上の列の移動平均を計算するには、次の構文を使用できます。
df[' column_name ']. rolling ( rolling_window ). mean ()
このチュートリアルでは、この関数の実際の使用例をいくつか紹介します。
例: pandas での移動平均の計算
次のパンダ データフレームがあるとします。
 import numpy as np
import pandas as pd

#make this example reproducible
n.p. random . seeds (0)

#create dataset
period = np. arange (1, 101, 1)
leads = np. random . uniform (1, 20, 100)
sales = 60 + 2*period + np. random . normal (loc=0, scale=.5*period, size=100)
df = pd. DataFrame ({' period ': period, ' leads ': leads, ' sales ': sales})

#view first 10 rows
df. head (10)

   period leads sales
0 1 11.427457 61.417425
1 2 14.588598 64.900826
2 3 12.452504 66.698494
3 4 11.352780 64.927513
4 5 9.049441 73.720630
5 6 13.271988 77.687668
6 7 9.314157 78.125728
7 8 17.943687 75.280301
8 9 19.309592 73.181613
9 10 8.285389 85.272259
次の構文を使用して、過去 5 期間の「売上高」の移動平均を含む新しい列を作成できます。
 #find rolling mean of previous 5 sales periods
df[' rolling_sales_5 '] = df[' sales ']. rolling (5). mean ()

#view first 10 rows
df. head (10)

	period leads sales rolling_sales_5
0 1 11.427457 61.417425 NaN
1 2 14.588598 64.900826 NaN
2 3 12.452504 66.698494 NaN
3 4 11.352780 64.927513 NaN
4 5 9.049441 73.720630 66.332978
5 6 13.271988 77.687668 69.587026
6 7 9.314157 78.125728 72.232007
7 8 17.943687 75.280301 73.948368
8 9 19.309592 73.181613 75.599188
9 10 8.285389 85.272259 77.909514
期間 5 に表示されるローリング販売平均が、前の 5 期間の平均であることを手動で確認できます。
期間 5 の移動平均: (61.417+64.900+66.698+64.927+73.720)/5 = 66.33
同様の構文を使用して、複数の列の移動平均を計算できます。
 #find rolling mean of previous 5 leads periods
df[' rolling_leads_5 '] = df[' leads ']. rolling (5). mean ()

#find rolling mean of previous 5 leads periods
df[' rolling_sales_5 '] = df[' sales ']. rolling (5). mean ()

#view first 10 rows
df. head (10)

	period leads sales rolling_sales_5 rolling_leads_5
0 1 11.427457 61.417425 NaN NaN
1 2 14.588598 64.900826 NaN NaN
2 3 12.452504 66.698494 NaN NaN
3 4 11.352780 64.927513 NaN NaN
4 5 9.049441 73.720630 66.332978 11.774156
5 6 13.271988 77.687668 69.587026 12.143062
6 7 9.314157 78.125728 72.232007 11.088174
7 8 17.943687 75.280301 73.948368 12.186411
8 9 19.309592 73.181613 75.599188 13.777773
9 10 8.285389 85.272259 77.909514 13.624963
Matplotlib を使用して簡単な折れ線プロットを作成し、総売上高と移動売上平均を視覚化することもできます。
 import matplotlib. pyplot as plt
plt. plot (df[' rolling_sales_5 '], label=' Rolling Mean ')
plt. plot (df[' sales '], label=' Raw Data ')
plt. legend ()
plt. ylabel (' Sales ')
plt. xlabel (' Period ')
plt. show ()
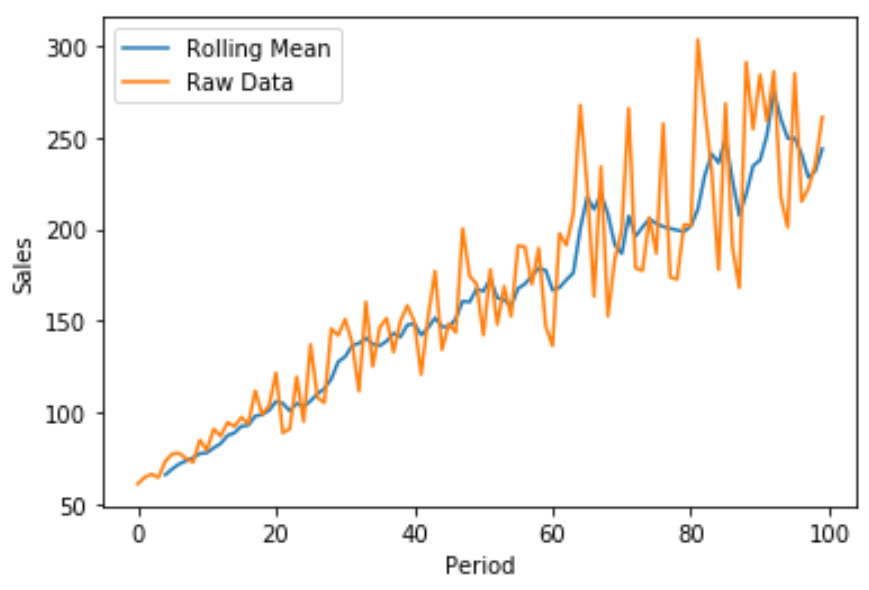
青い線は売上の 5 期間移動平均を示し、オレンジ色の線は生の売上データを示します。
追加リソース
次のチュートリアルでは、パンダで他の一般的なタスクを実行する方法を説明します。
著者について
ベンジャミン・アンダーソン博士
私はベンジャミンです。退職した統計教授から、専任の Statorials 教育者になりました。 統計分野における豊富な経験と専門知識を活かして、私は Statorials を通じて学生に力を与えるために自分の知識を共有することに尽力しています。もっと知る