Pandas 시리즈를 그리는 방법(예제 포함)
팬더 시리즈의 값을 그리는 일반적인 방법에는 두 가지가 있습니다.
방법 1: Pandas 계열에서 선 그림 만들기
 import pandas as pd
import matplotlib. pyplot as plt

plt. plot ( my_series.index , my_series.values )
방법 2: Pandas 시리즈에서 히스토그램 만들기
 import pandas as pd
import matplotlib. pyplot as plt

my_series. plot (kind=' hist ')
다음 예에서는 각 방법을 실제로 사용하는 방법을 보여줍니다.
예 1: Pandas 시리즈에서 선 플롯 생성
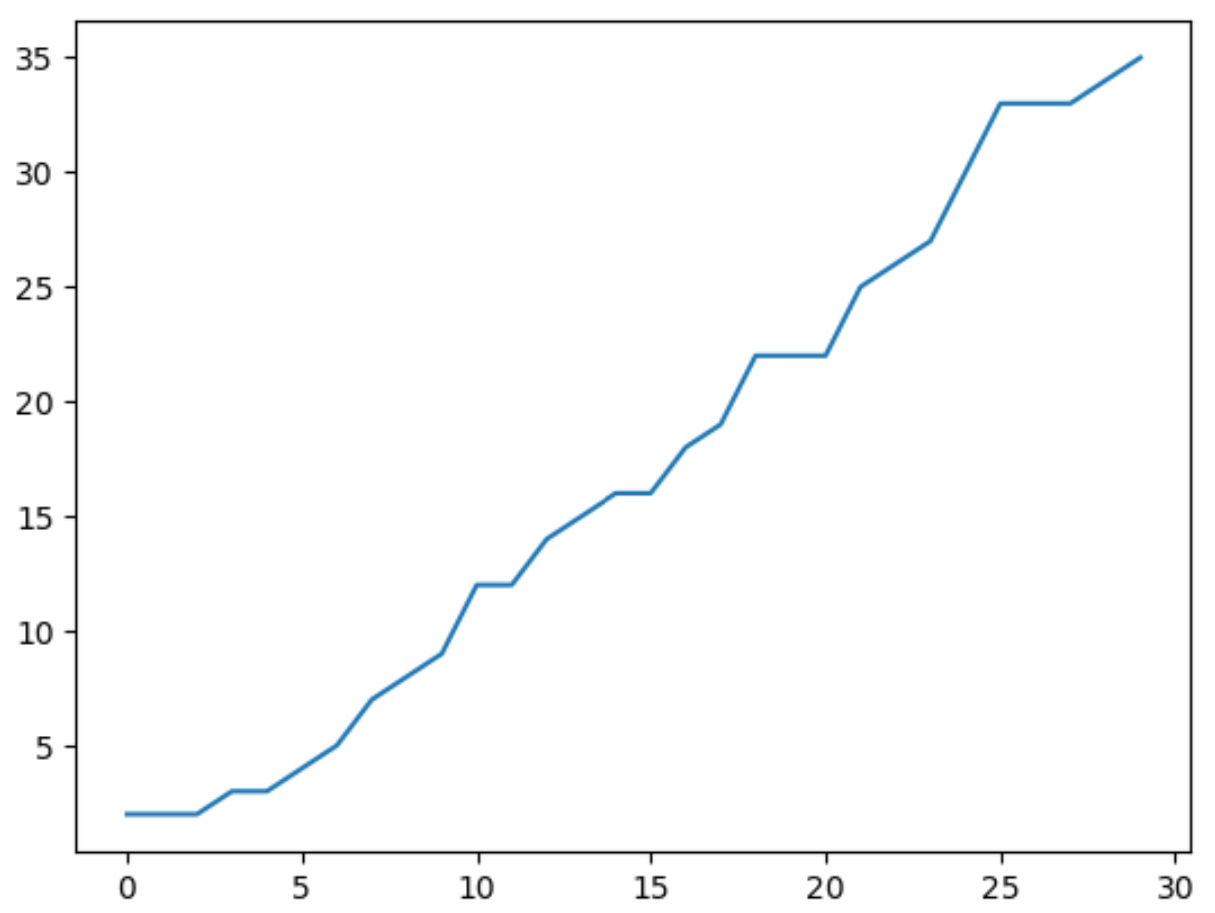
다음 코드는 Pandas 시리즈에서 선 플롯을 생성하는 방법을 보여줍니다.
 import pandas as pd
import matplotlib. pyplot as plt

#create pandas Series
my_series = pd. Series ([2, 2, 2, 3, 3, 4, 5, 7, 8, 9, 12, 12, 14, 15, 16, 16, 18,
                       19, 22, 22, 22, 25, 26, 27, 30, 33, 33, 33, 34, 35])

#create line plot to visualize values in Series
plt. plot ( my_series.index , my_series.values )

x축은 팬더 시리즈의 인덱스 값을 나타내고, y축은 시리즈의 실제 값을 나타냅니다.
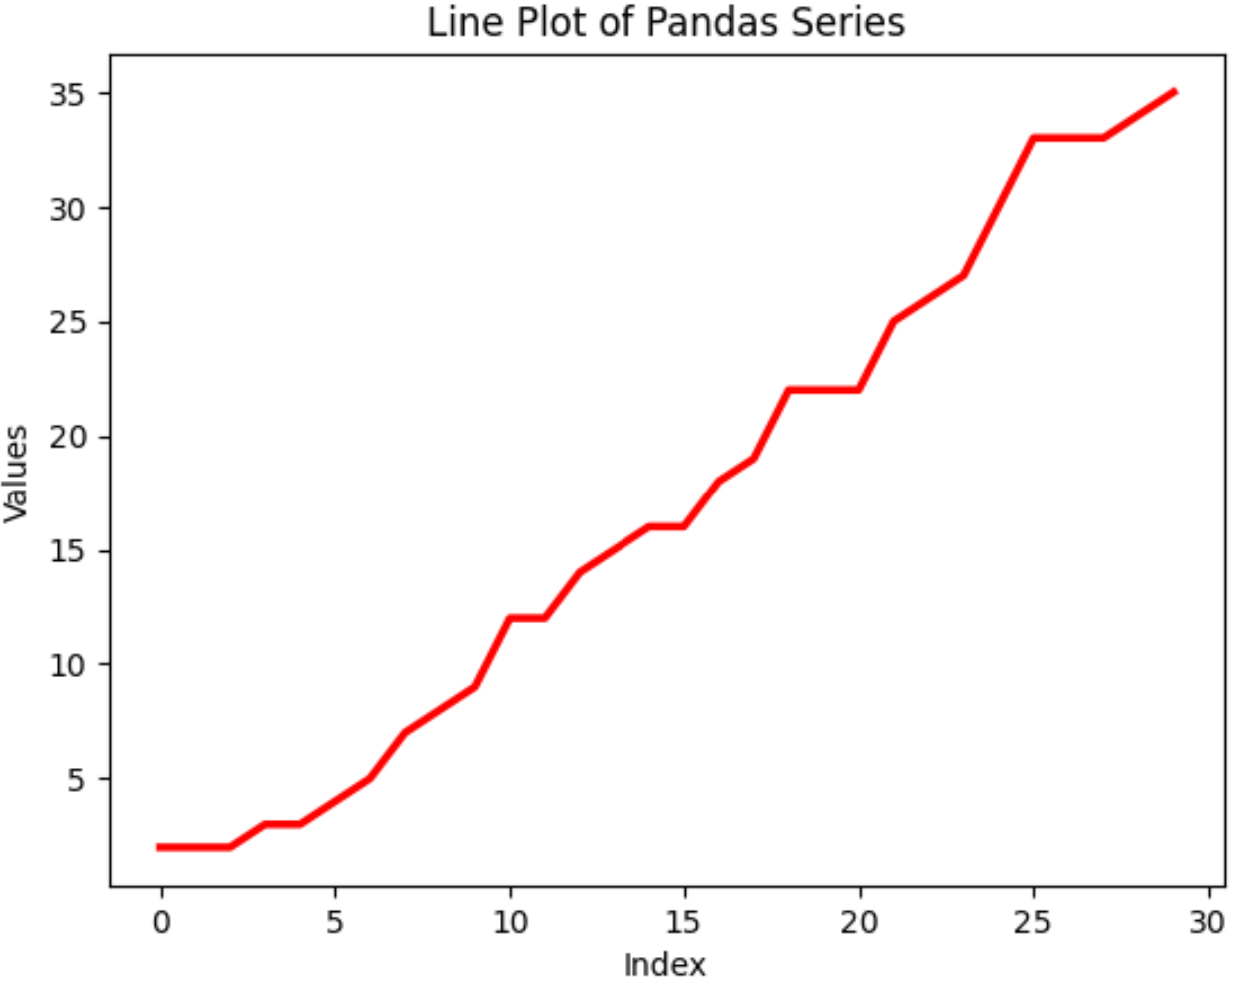
다양한 pandas 및 matplotlib 함수를 사용하여 선의 모양과 축 레이블 및 플롯 제목을 사용자 정의할 수도 있습니다.
 #create customized line plot
plt. plot (my_series. index , my_series. values , color=' red ', linewidth= 2.5 )

#add axis labels and title
plt. xlabel (' Index ')
plt. ylabel (' Values ')
plt. title (' Line Plot of Pandas Series ')

예 2: 일련의 팬더에서 히스토그램 만들기
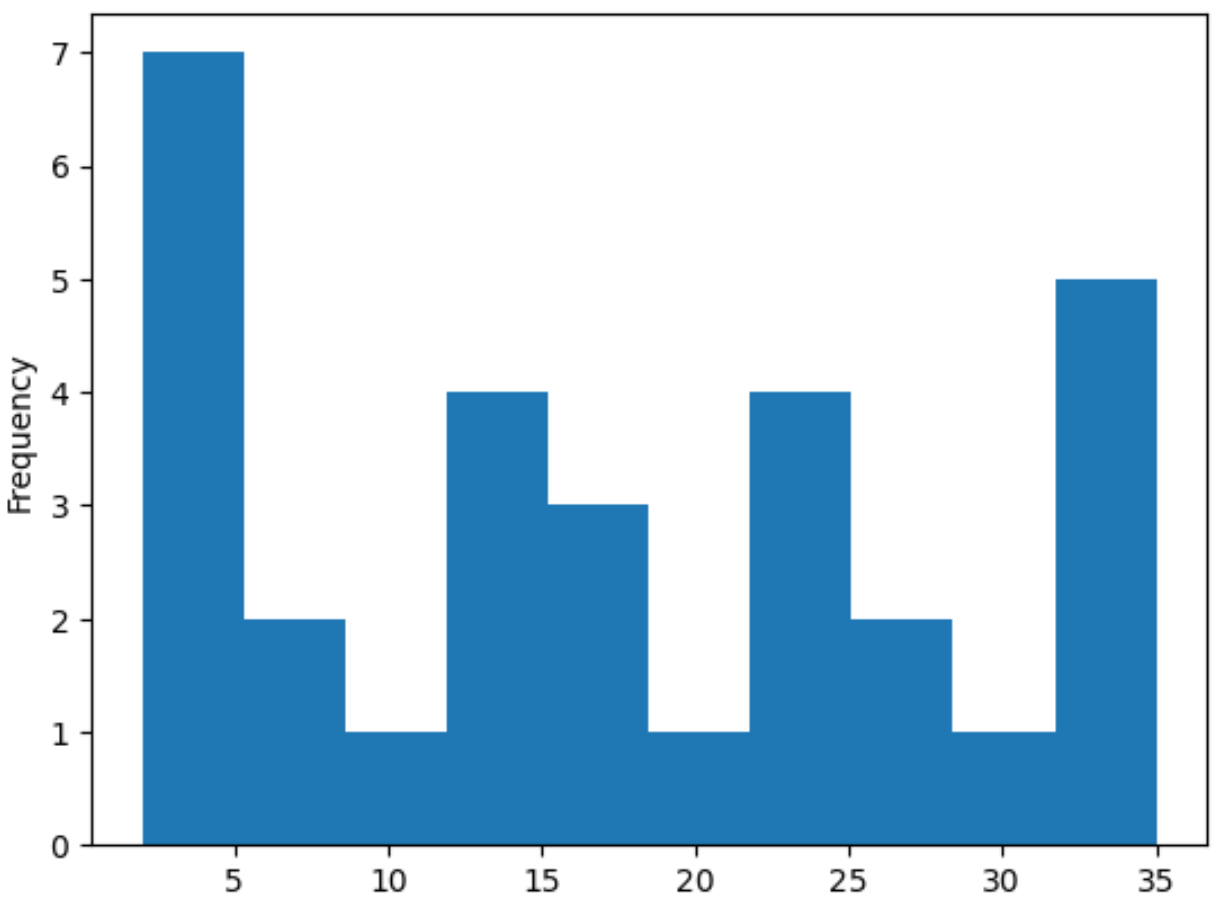
다음 코드는 Pandas 시리즈에서 히스토그램을 만드는 방법을 보여줍니다.
 import pandas as pd
import matplotlib. pyplot as plt

#create pandas Series
my_series = pd. Series ([2, 2, 2, 3, 3, 4, 5, 7, 8, 9, 12, 12, 14, 15, 16, 16, 18,
                       19, 22, 22, 22, 25, 26, 27, 30, 33, 33, 33, 34, 35])

#create histogram visualize distribution of values in Series
my_series. plot (kind=' hist ')

x축은 pandas 시리즈의 값을 나타내고 y축은 값의 빈도를 나타냅니다.
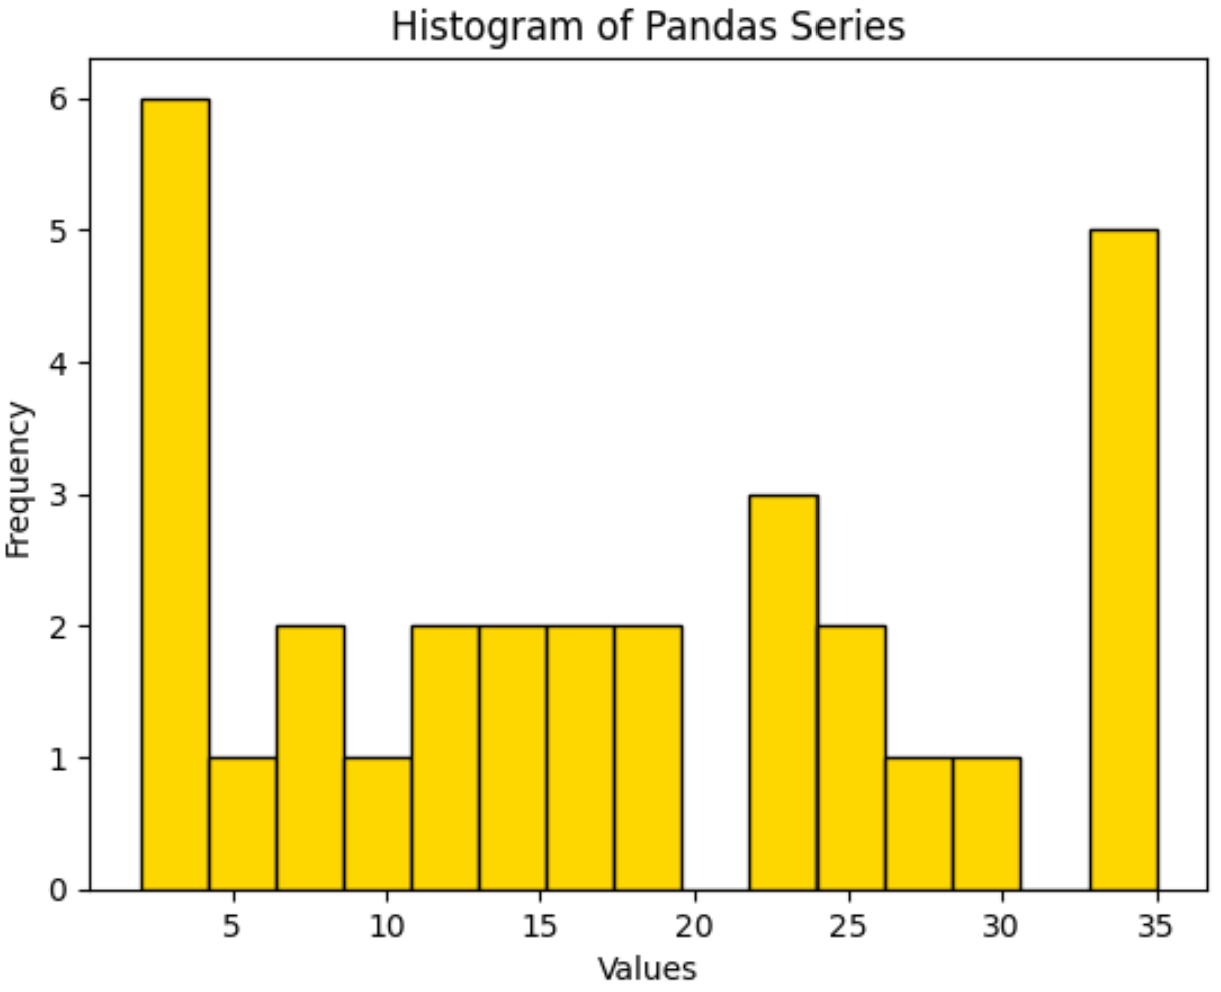
또한 다양한 pandas 및 matplotlib 함수를 사용하여 히스토그램의 모양과 히스토그램에 사용되는 빈 수를 사용자 정의할 수 있습니다.
 #create histogram with 15 bins
my_series. plot (kind=' hist ', edgecolor=' black ', color=' gold ', bins= 15 )

#add axis labels and title
plt. xlabel (' Values ')
plt. title (' Histogram of Pandas Series ')

히스토그램에 사용되는 기본 그룹 수는 10개 입니다.
bins 인수를 사용하여 이 숫자를 늘려 더 많은 bin을 생성하거나 이 숫자를 줄여 더 적은 수의 bin을 생성할 수 있습니다.
추가 리소스
다음 튜토리얼에서는 Pandas에서 다른 일반적인 작업을 수행하는 방법을 설명합니다.
Pandas 시리즈를 값으로 필터링하는 방법
Pandas 시리즈를 DataFrame으로 변환하는 방법
Pandas 시리즈를 NumPy 배열로 변환하는 방법