Ggplot2에서 로그 눈금을 만드는 방법
종종 ggplot2 플롯의 x축이나 y축의 스케일을 로그 스케일로 변환하고 싶을 수도 있습니다.
ggplot2만 사용하여 이 작업을 수행하려면 다음 두 가지 방법 중 하나를 사용할 수 있습니다.
1. scale_y_continuous() 또는 scale_x_continuous()를 사용하세요.
 ggplot(df, aes (x=x, y=y)) +
  geom_point() +
  scale_y_continuous(trans=' log10 ') +
  scale_x_continuous(trans=' log10 ')
2.coordinate_trans()를 사용하세요
 ggplot(df, aes (x=x, y=y)) +
  geom_point() +
  coord_trans(y = ' log10 ' , x=' log10 ')
지수를 표시하기 위해 축 레이블의 형식을 지정하려면 scales 패키지의 함수를 사용할 수 있습니다.
 ggplot(df, aes (x=x, y=y)) +
  geom_point() +
  scale_y_continuous(trans=' log10 ',
                     breaks= trans_breaks (' log10 ', function (x) 10^x),
                     labels= trans_format (' log10 ', math_format (10^.x)))
이 튜토리얼에서는 이러한 기능을 실제로 사용하는 방법의 예를 보여줍니다.
예제 1: scale_y_continuous()를 사용한 로그 스케일
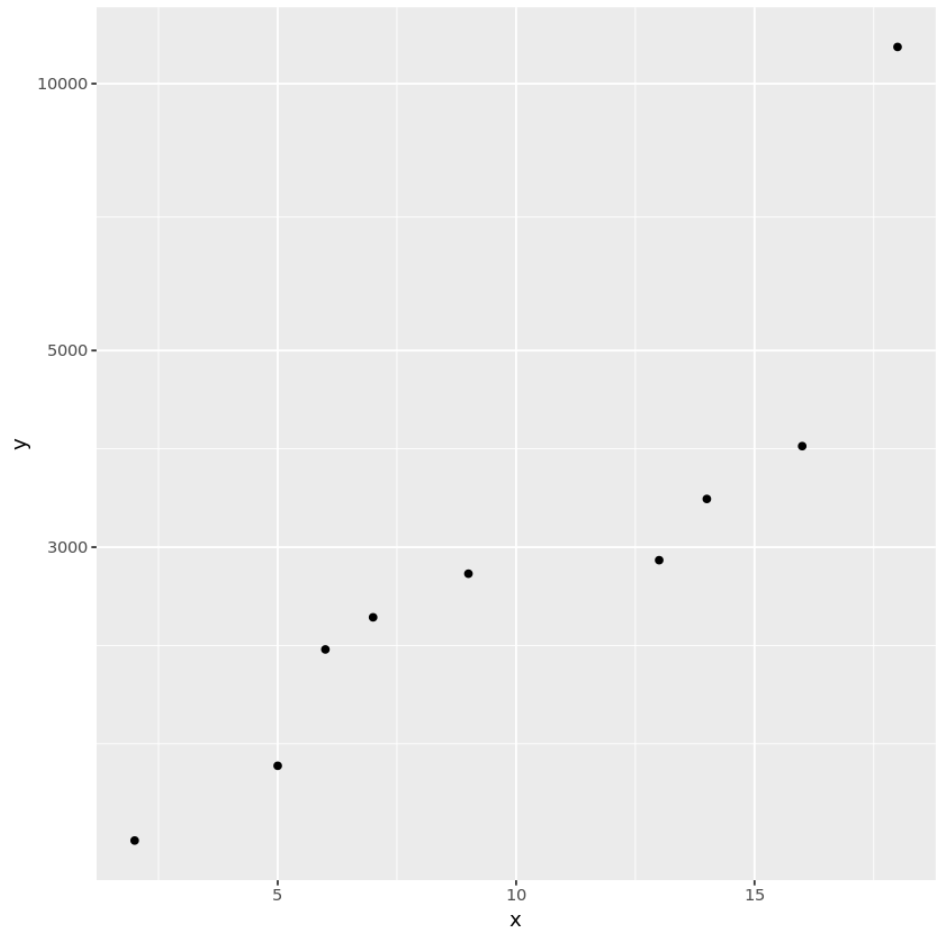
다음 코드는 scale_y_continuous() 함수를 사용하여 산점도의 y축에 대한 로그 눈금을 생성하는 방법을 보여줍니다.
 library (ggplot2)

#create data frame
df <- data.frame(x=c(2, 5, 6, 7, 9, 13, 14, 16, 18),
                 y=c(1400, 1700, 2300, 2500, 2800, 2900, 3400, 3900, 11000))

#create scatterplot with log scale on y-axis
ggplot(df, aes (x=x, y=y)) +
  geom_point() +
  scale_y_continuous(trans=' log10 ')
예제 2: coord_trans()를 사용한 로그 스케일
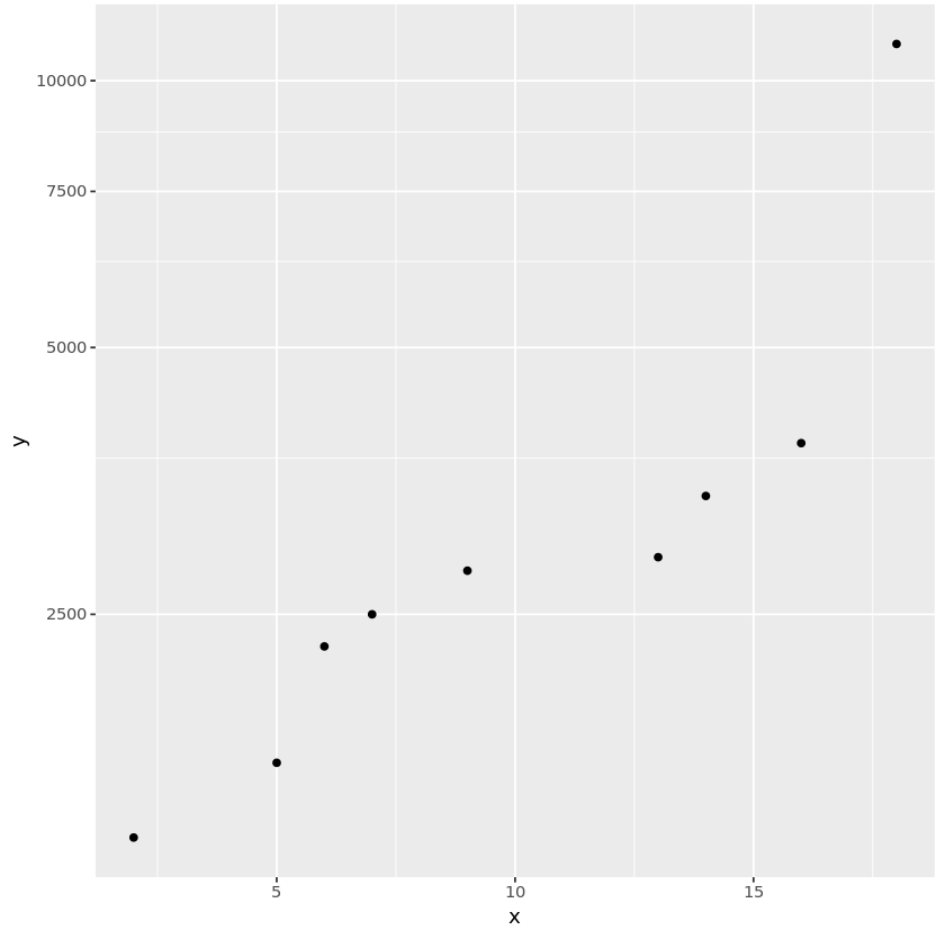
다음 코드는 coord_trans() 함수를 사용하여 산점도의 y축에 대한 로그 눈금을 생성하는 방법을 보여줍니다.
 library (ggplot2)

#create data frame
df <- data.frame(x=c(2, 5, 6, 7, 9, 13, 14, 16, 18),
                 y=c(1400, 1700, 2300, 2500, 2800, 2900, 3400, 3900, 11000))

#create scatterplot with log scale on y-axis
ggplot(df, aes (x=x, y=y)) +
  geom_point() +
  coord_trans(y=' log10 ')
예 3: 사용자 정의 로그 눈금 레이블
다음 코드는 scales 패키지의 함수를 사용하여 산점도의 y축에 대한 로그 척도를 만들고 지수가 포함된 사용자 정의 레이블을 추가하는 방법을 보여줍니다.
 library (ggplot2)
library (scales)

#create data frame
df <- data.frame(x=c(2, 5, 6, 7, 9, 13, 14, 16, 18),
                 y=c(1400, 1700, 2300, 2500, 2800, 2900, 3400, 3900, 11000))

#create scatterplot with log scale on y-axis and custom labels
ggplot(df, aes (x=x, y=y)) +
  geom_point() +
  scale_y_continuous(trans=' log10 ',
                     breaks= trans_breaks (' log10 ', function (x) 10^x),
                     labels= trans_format (' log10 ', math_format (10^.x)))
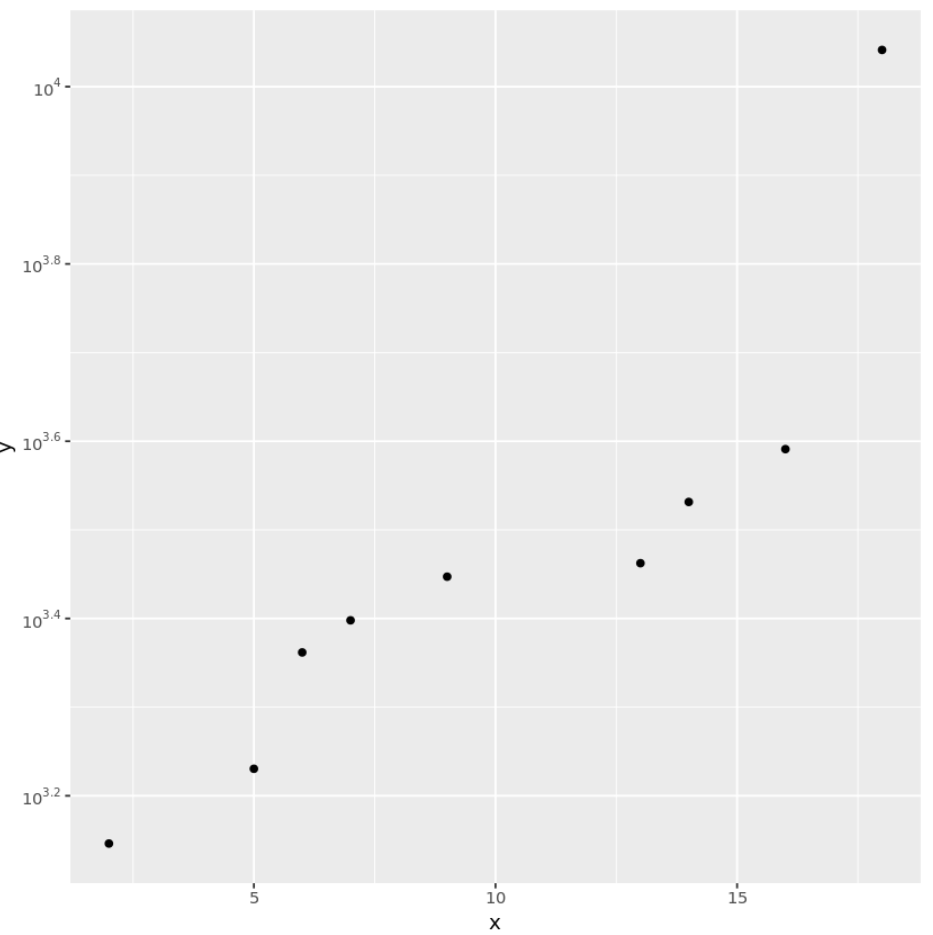
이전 두 플롯과 달리 Y축 레이블에는 지수가 있습니다.
추가 리소스
ggplot2 타이틀에 대한 전체 가이드
최고의 ggplot2 테마에 대한 완벽한 가이드
ggplot2에서 병렬 플롯을 만드는 방법
저자 소개
벤자민 앤더슨
안녕하세요. 저는 통계학 교수를 퇴직하고 전임 통계 교사로 변신한 벤자민입니다. 통계 분야의 광범위한 경험과 전문 지식을 바탕으로 Statorials를 통해 학생들에게 힘을 실어주기 위해 지식을 공유하고 싶습니다. 더 알아보기