Matplotlib에서 tight_layout()을 사용하는 방법
Matplotlib의 Tight_layout() 함수를 사용하여 서브플롯 사이 및 주변의 패딩을 자동으로 조정할 수 있습니다.
다음 예에서는 이 기능을 실제로 사용하는 방법을 보여줍니다.
예: Matplotlib에서 Tight_layout()을 사용하는 방법
Matplotilb를 사용하여 2×2 그리드에 4개의 하위 플롯을 생성한다고 가정합니다.
 import matplotlib. pyplot as plt

#define data
x = [1, 2, 3]
y = [7, 13, 24]

#define layout for subplots
fig, ax = plt. subplots (2, 2)

#define subplot titles
ax[0, 0]. plot (x,y,color=' red ')
ax[0, 1]. plot (x,y,color=' blue ')
ax[1, 0]. plot (x,y,color=' green ')
ax[1, 1]. plot (x,y,color=' purple ')

#add title to each subplot
ax[0, 0]. set_title (' First Subplot ')
ax[0, 1]. set_title (' Second Subplot ')
ax[1, 0]. set_title (' Third Subplot ')
ax[1, 1]. set_title (' Fourth Subplot ')
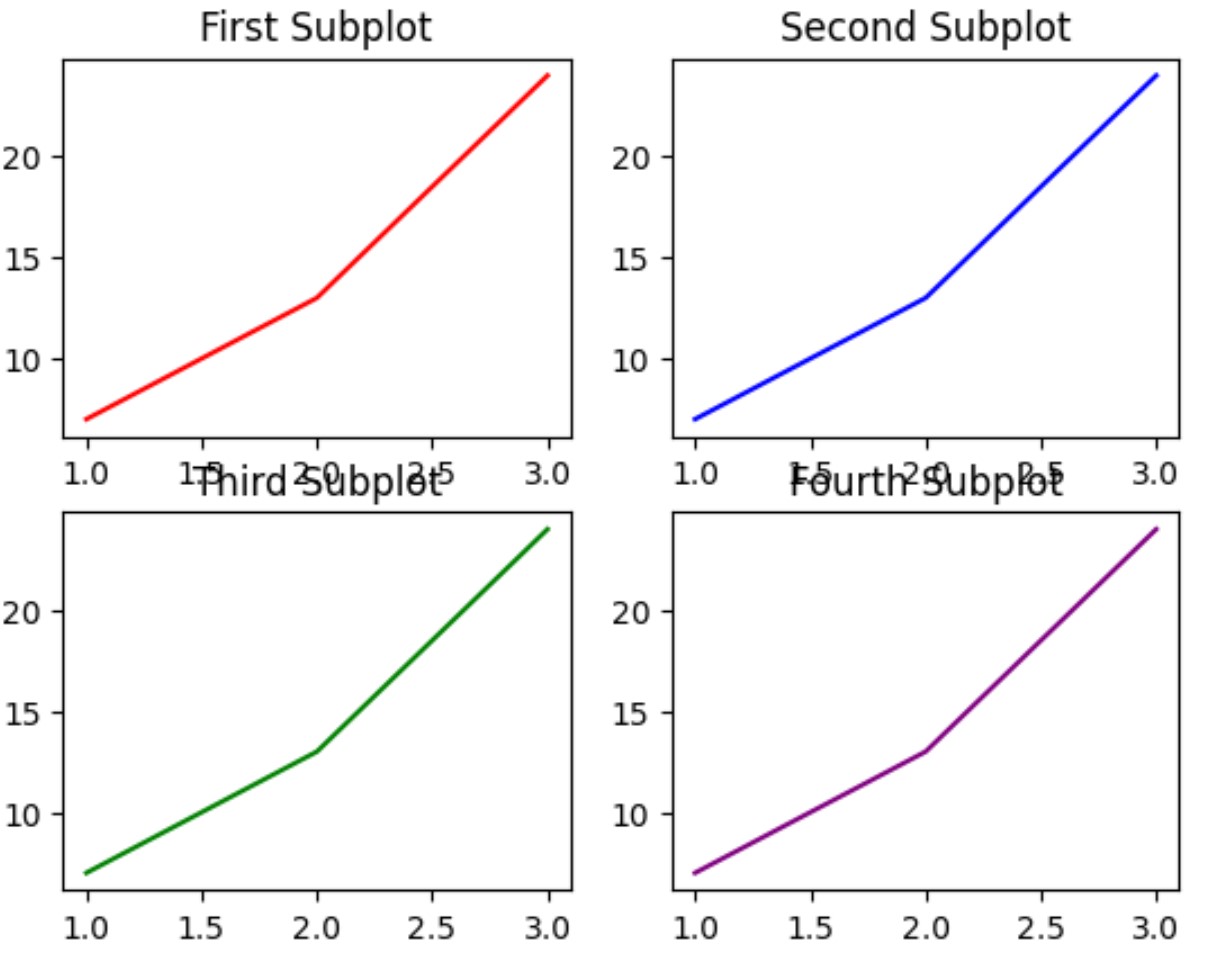
서브플롯 사이에는 최소한의 패딩이 있으므로 일부 위치에서는 제목이 겹칠 수 있습니다.
fig.tight_layout()을 지정하면 하위 플롯 사이와 주변의 패딩을 자동으로 조정할 수 있습니다.
 import matplotlib. pyplot as plt

#define data
x = [1, 2, 3]
y = [7, 13, 24]

#define layout for subplots
fig, ax = plt. subplots (2, 2)

#specify a tight layout
fig. tight_layout ()

#define subplot titles
ax[0, 0]. plot (x,y,color=' red ')
ax[0, 1]. plot (x,y,color=' blue ')
ax[1, 0]. plot (x,y,color=' green ')
ax[1, 1]. plot (x,y,color=' purple ')

#add title to each subplot
ax[0, 0]. set_title (' First Subplot ')
ax[0, 1]. set_title (' Second Subplot ')
ax[1, 0]. set_title (' Third Subplot ')
ax[1, 1]. set_title (' Fourth Subplot ')
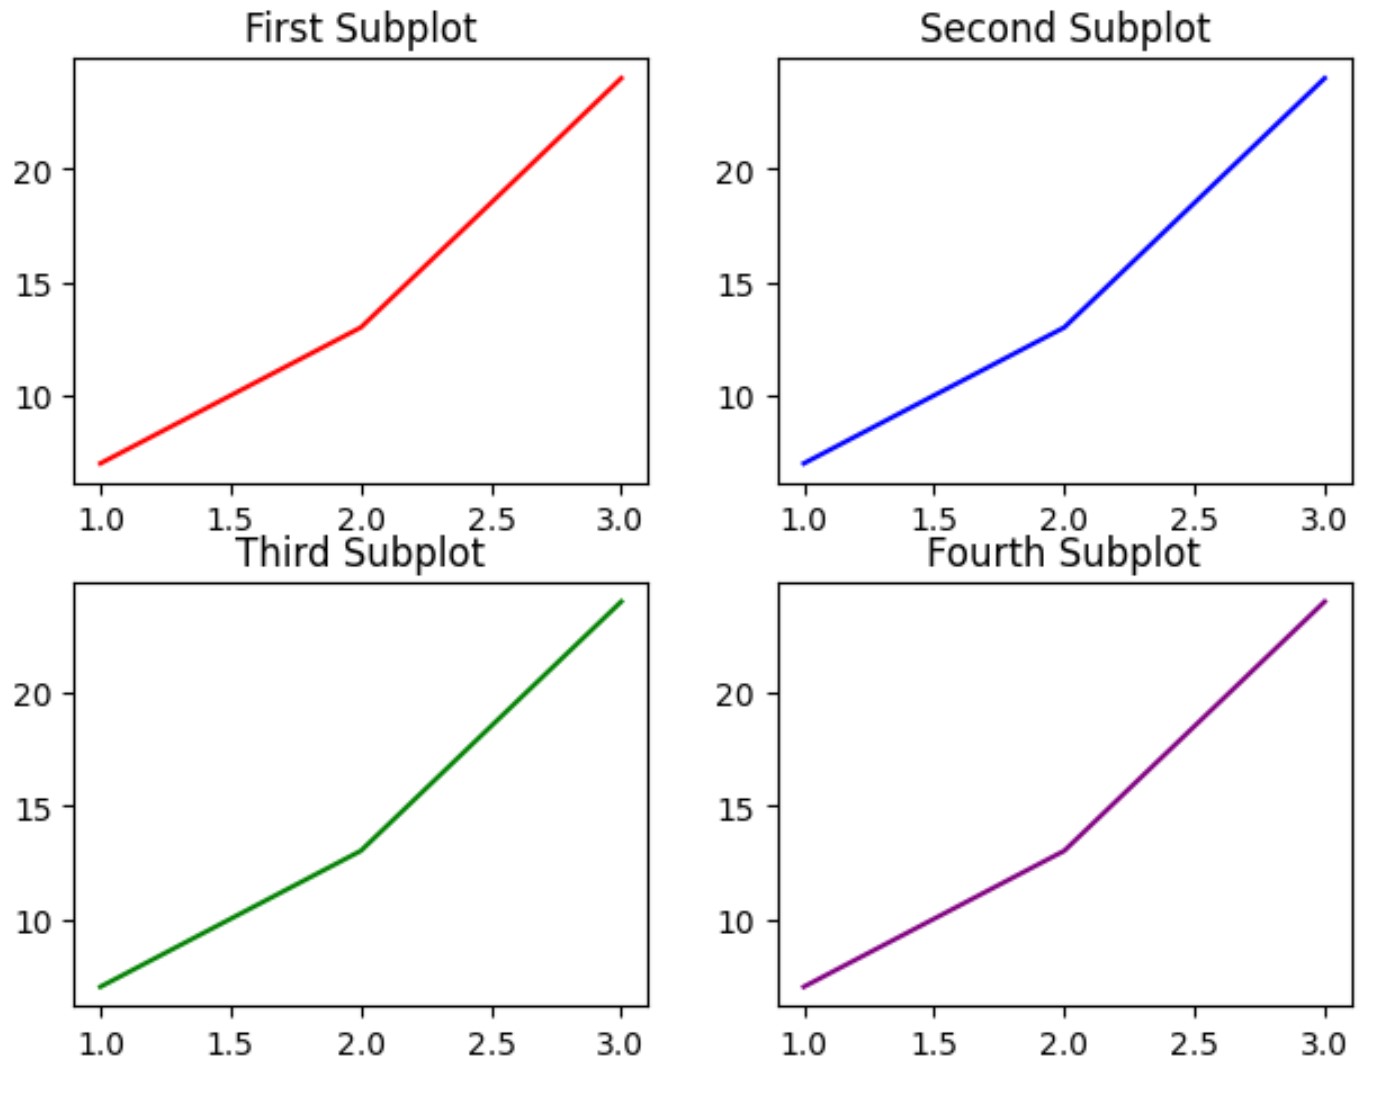
플롯이 더 이상 어떤 영역에서도 겹치지 않도록 서브플롯 사이와 주변의 패딩이 조정되었습니다.
Tight_layout() 함수는 그림 가장자리와 하위 경로 가장자리 사이의 패딩을 글꼴 크기의 일부로 지정하기 위해 pad 인수를 사용합니다.
기본 패드 값은 1.08 입니다. 그러나 이 값을 늘려 경로 주변의 패딩을 늘릴 수 있습니다.
 import matplotlib. pyplot as plt

#define data
x = [1, 2, 3]
y = [7, 13, 24]

#define layout for subplots
fig, ax = plt. subplots (2, 2)

#specify a tight layout with increased padding
fig. tight_layout (pad=5)

#define subplot titles
ax[0, 0]. plot (x,y,color=' red ')
ax[0, 1]. plot (x,y,color=' blue ')
ax[1, 0]. plot (x,y,color=' green ')
ax[1, 1]. plot (x,y,color=' purple ')

#add title to each subplot
ax[0, 0]. set_title (' First Subplot ')
ax[0, 1]. set_title (' Second Subplot ')
ax[1, 0]. set_title (' Third Subplot ')
ax[1, 1]. set_title (' Fourth Subplot ')
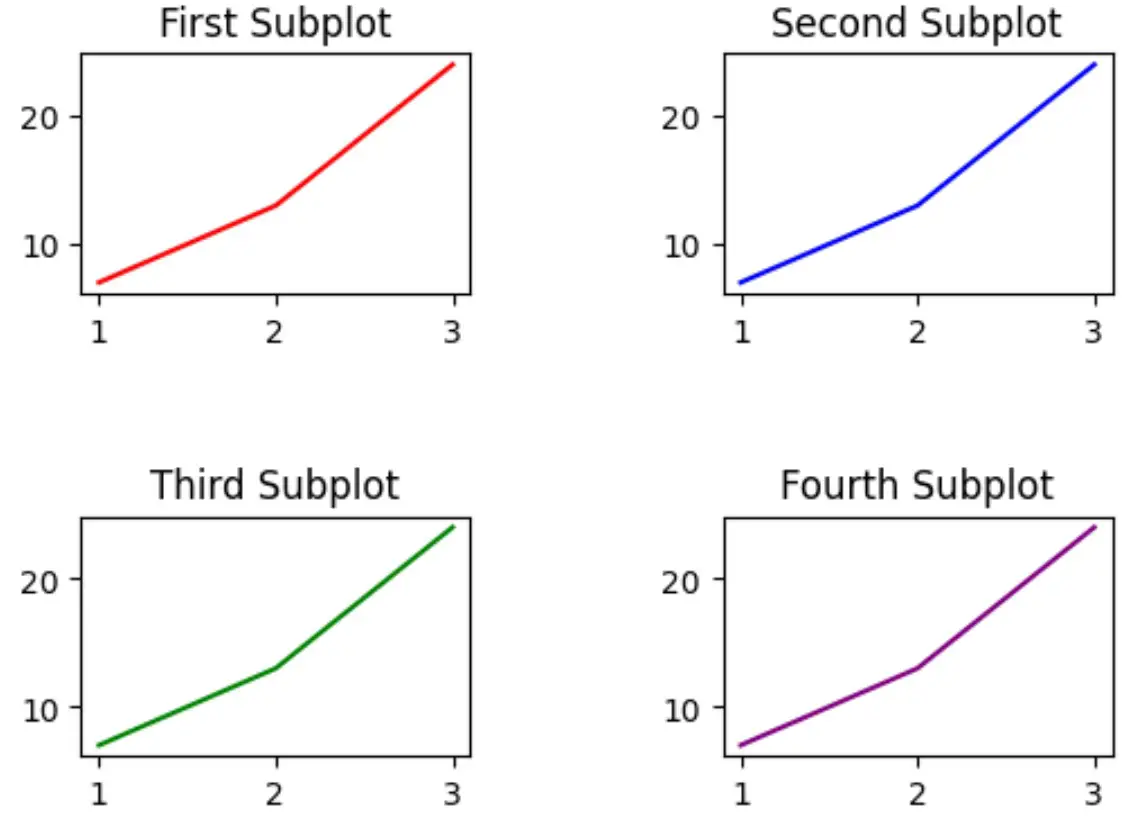
플롯 주변의 채우기가 눈에 띄게 증가했습니다.
원하는 만큼 경로 주위의 패딩을 늘리려면 pad 인수의 값을 자유롭게 조정하십시오.
추가 리소스
다음 튜토리얼에서는 Matplotlib에서 다른 일반적인 작업을 수행하는 방법을 설명합니다.
Matplotlib의 서브플롯에 제목을 추가하는 방법
Matplotlib에서 서브플롯 크기를 조정하는 방법
Matplotlib 서브플롯 사이의 간격을 조정하는 방법
저자 소개
벤자민 앤더슨
안녕하세요. 저는 통계학 교수를 퇴직하고 전임 통계 교사로 변신한 벤자민입니다. 통계 분야의 광범위한 경험과 전문 지식을 바탕으로 Statorials를 통해 학생들에게 힘을 실어주기 위해 지식을 공유하고 싶습니다. 더 알아보기