Ggplot2에서 배경색을 변경하는 방법(예제 포함)
다음 구문을 사용하여 ggplot2 플롯에서 다양한 요소의 배경색을 변경할 수 있습니다.
 p + theme(panel. background = element_rect(fill = ' lightblue ', color = ' purple '),
          panel. grid . major = element_line(color = ' red ', linetype = ' dotted '),
          panel. grid . minor = element_line(color = ' green ', size = 2 ))
내장된 ggplot2 테마를 사용하여 배경색을 자동으로 변경할 수도 있습니다. 가장 일반적으로 사용되는 테마는 다음과 같습니다.
 p + theme_bw() #white background and gray gridlines
p + theme_minimal() #no background annotations
p + theme_classic() #axis lines but no gridlines
다음 예에서는 이 구문을 실제로 사용하는 방법을 보여줍니다.
예 1: 사용자 정의 배경색 지정
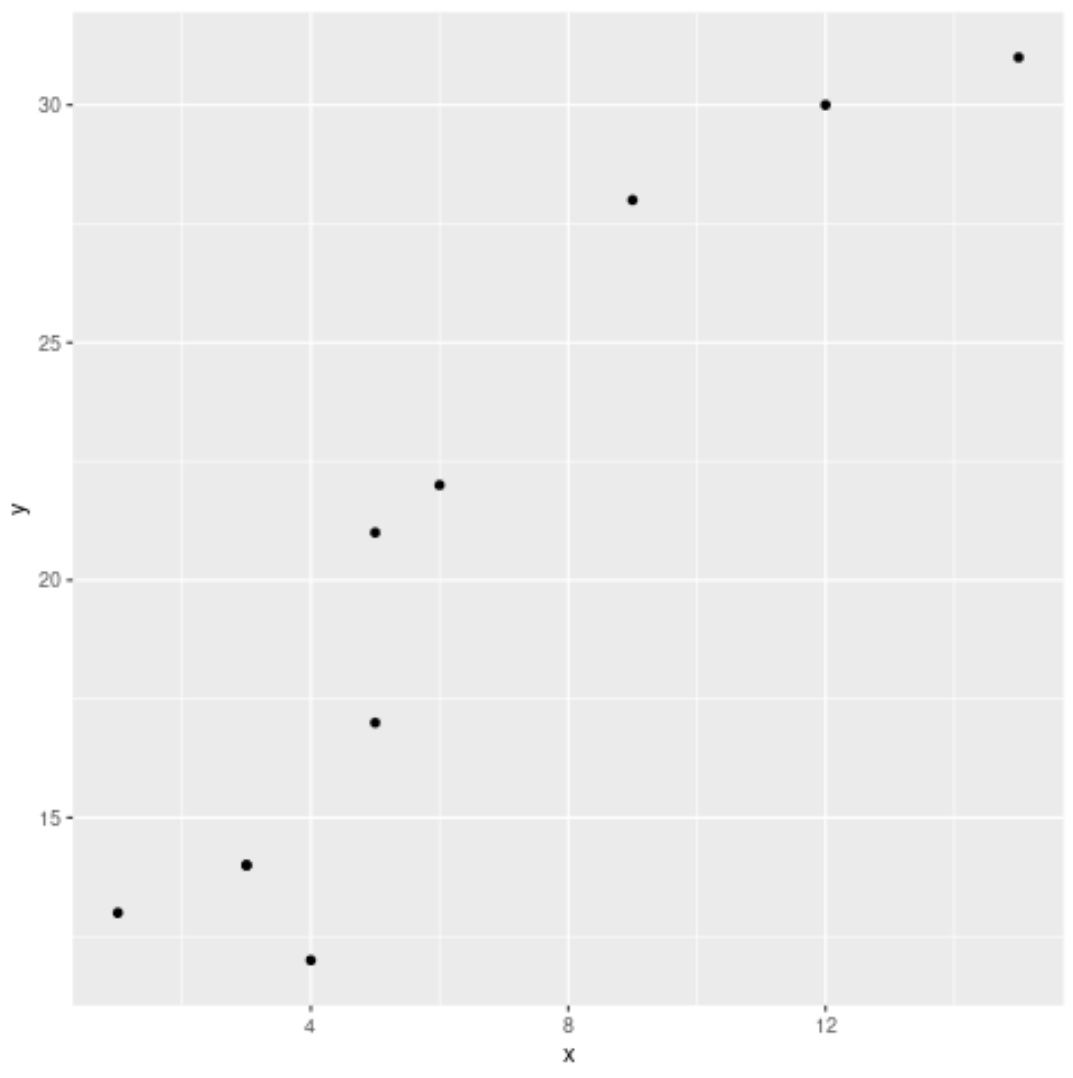
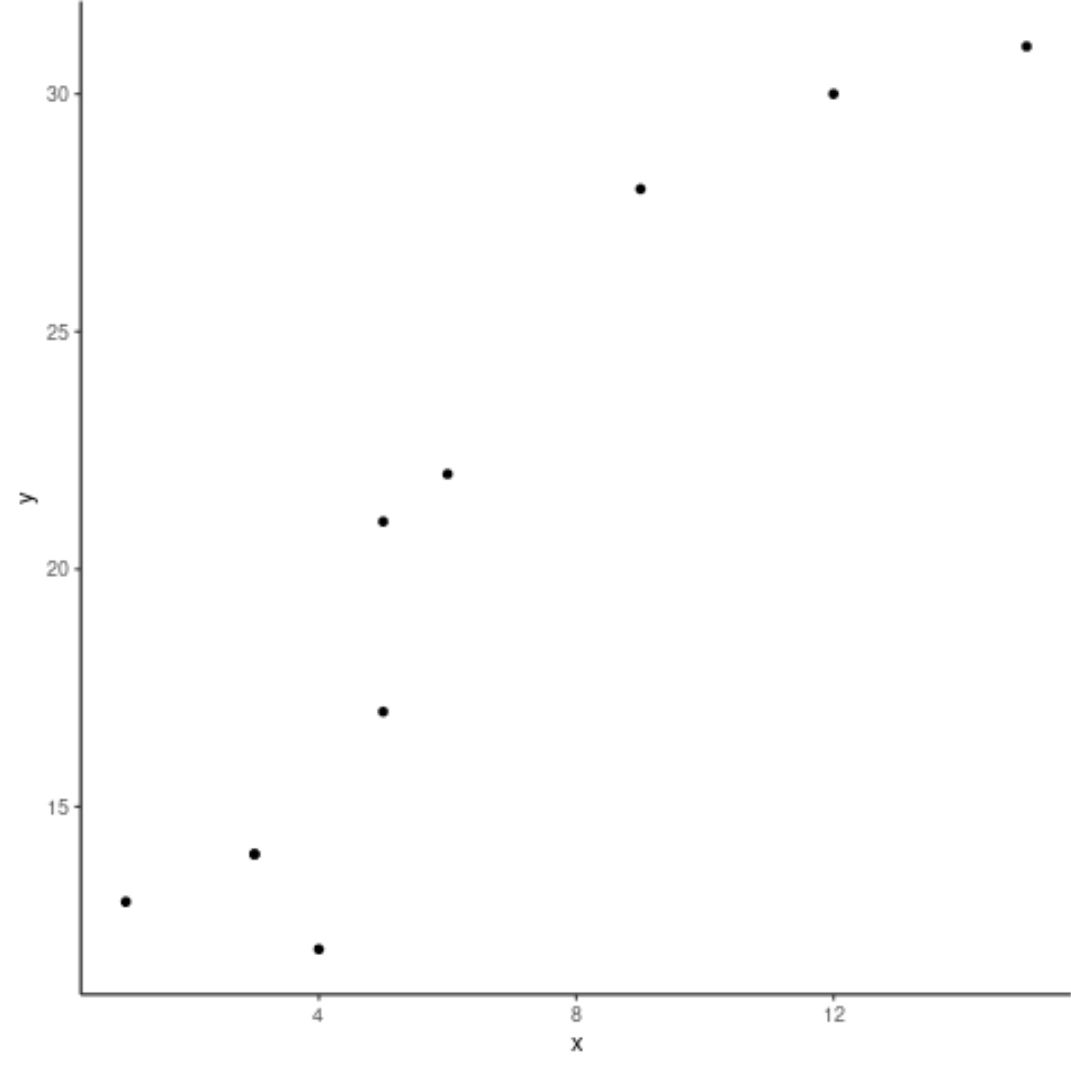
다음 코드는 기본 회색 배경을 사용하여 ggplot2에서 기본 산점도를 생성하는 방법을 보여줍니다.
 library (ggplot2)

#create data frame
df <- data. frame (x=c(1, 3, 3, 4, 5, 5, 6, 9, 12, 15),
                 y=c(13, 14, 14, 12, 17, 21, 22, 28, 30, 31))

#create scatterplot
p <- ggplot(df, aes (x=x, y=y)) +
       geom_point()

#display scatterplot
p
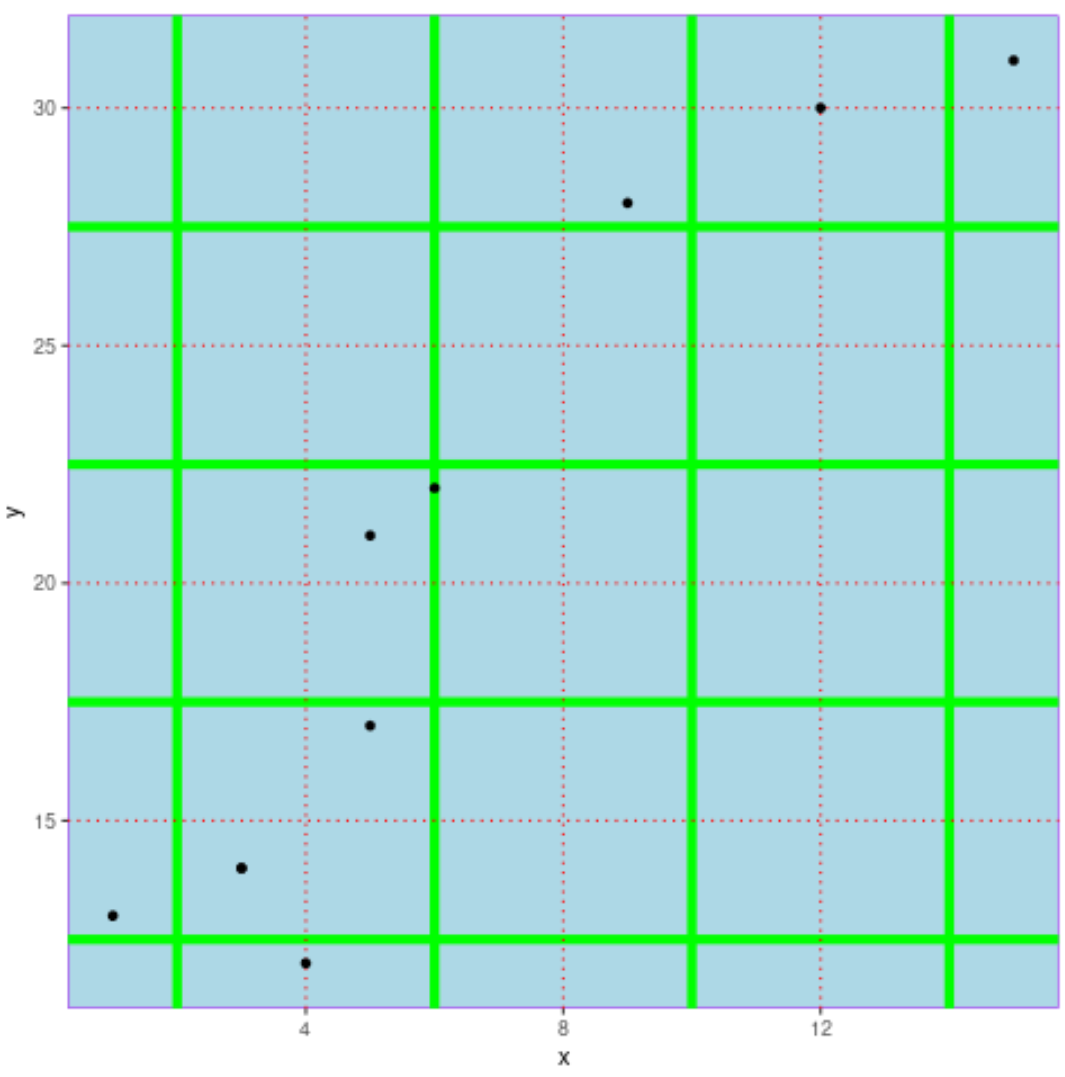
다음 코드를 사용하여 패널의 배경색과 주요 및 보조 격자선을 변경할 수 있습니다.
 p + theme(panel. background = element_rect(fill = ' lightblue ', color = ' purple '),
          panel. grid . major = element_line(color = ' red ', linetype = ' dotted '),
          panel. grid . minor = element_line(color = ' green ', size = 2 ))
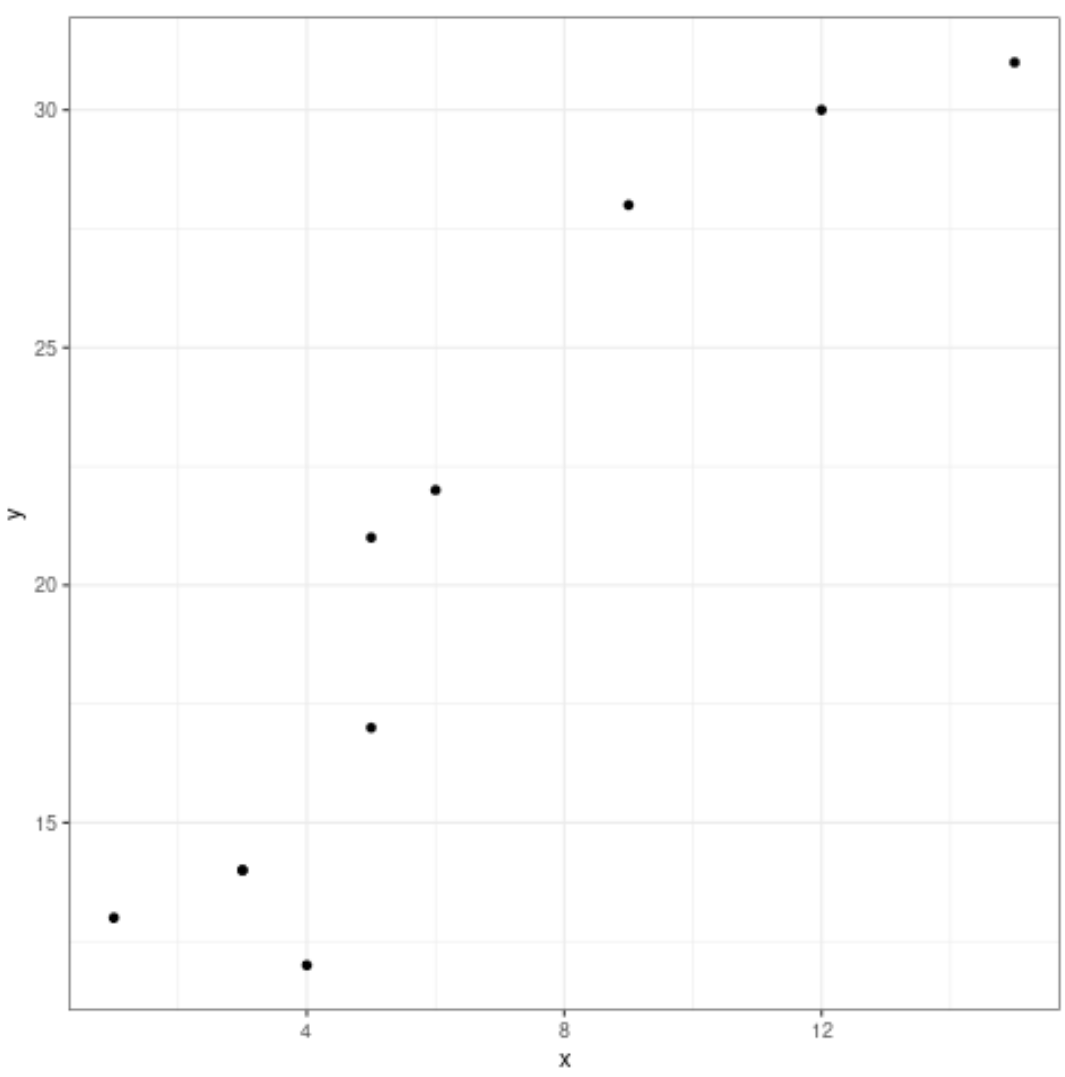
예 2: 내장 테마를 사용하여 배경색 변경
다음 코드는 다양한 내장 ggplot2 테마를 사용하여 플롯의 배경색을 자동으로 변경하는 방법을 보여줍니다.
p + theme_bw() #white background and gray gridlines
p + theme_minimal() #no background annotations
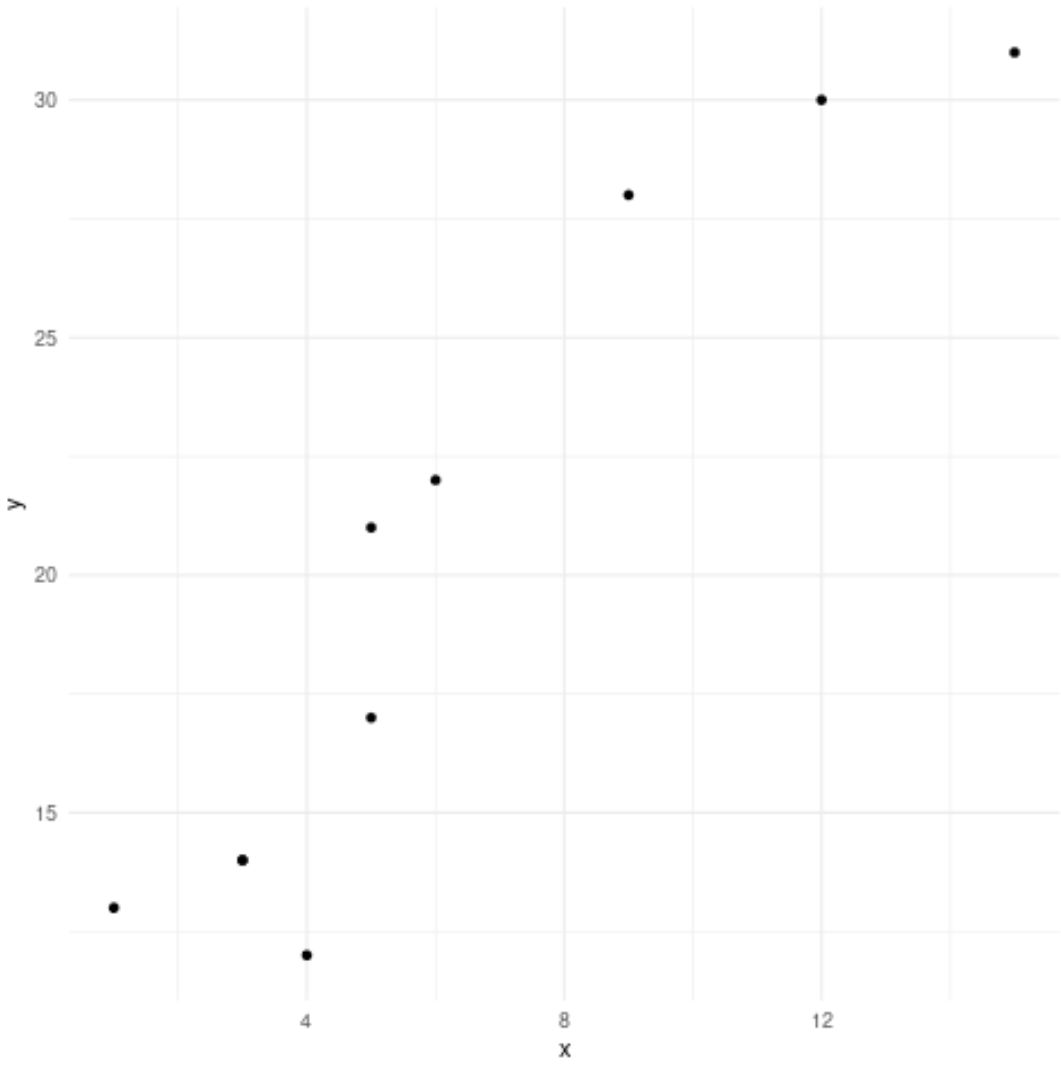
p + theme_classic() #axis lines but no gridlines
추가 리소스
ggplot2에서 눈금선을 제거하는 방법
ggplot2에서 축 제한을 설정하는 방법
ggplot2에서 범례 위치를 변경하는 방법
저자 소개
벤자민 앤더슨
안녕하세요. 저는 통계학 교수를 퇴직하고 전임 통계 교사로 변신한 벤자민입니다. 통계 분야의 광범위한 경험과 전문 지식을 바탕으로 Statorials를 통해 학생들에게 힘을 실어주기 위해 지식을 공유하고 싶습니다. 더 알아보기