Ggplot2의 히스토그램에 백분율을 표시하는 방법
다음 기본 구문을 사용하여 ggplot2에서 히스토그램의 y축에 백분율을 표시할 수 있습니다.
 library (ggplot2)
library (scales)

#create histogram with percentages
ggplot(data, aes (x = factor (team))) +
  geom_bar( aes (y = (..count..)/ sum (..count..))) +
  scale_y_continuous(labels=percent)
다음 예에서는 이 구문을 실제로 사용하는 방법을 보여줍니다.
예 1: 백분율이 포함된 기본 히스토그램
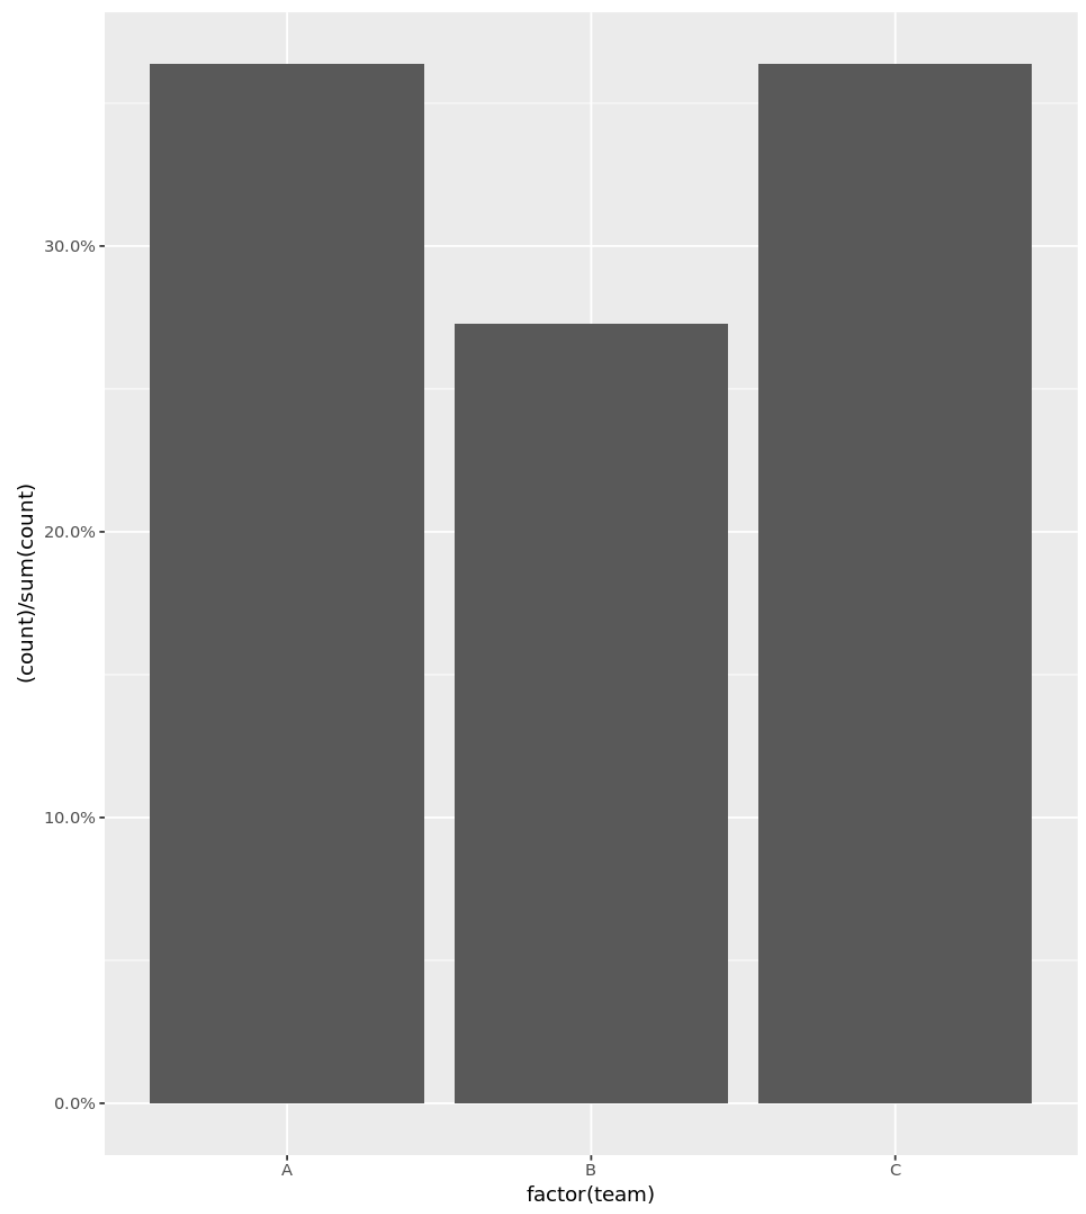
다음 코드는 Y축에 백분율이 표시된 범주형 변수에 대한 히스토그램을 만드는 방법을 보여줍니다.
 library (ggplot2)
library (scales)

#define data frame
data <- data. frame (team = c('A', 'A', 'A', 'A', 'B', 'B', 'B', 'C', 'C', 'C', 'C') ,
                   points = c(77, 79, 93, 85, 89, 99, 90, 80, 68, 91, 92))

#create histogram with percentages
ggplot(data, aes (x = factor (team))) +
  geom_bar( aes (y = (..count..)/ sum (..count..))) +
  scale_y_continuous(labels=percent)

예 2: 백분율이 포함된 히스토그램(소수점 제거)
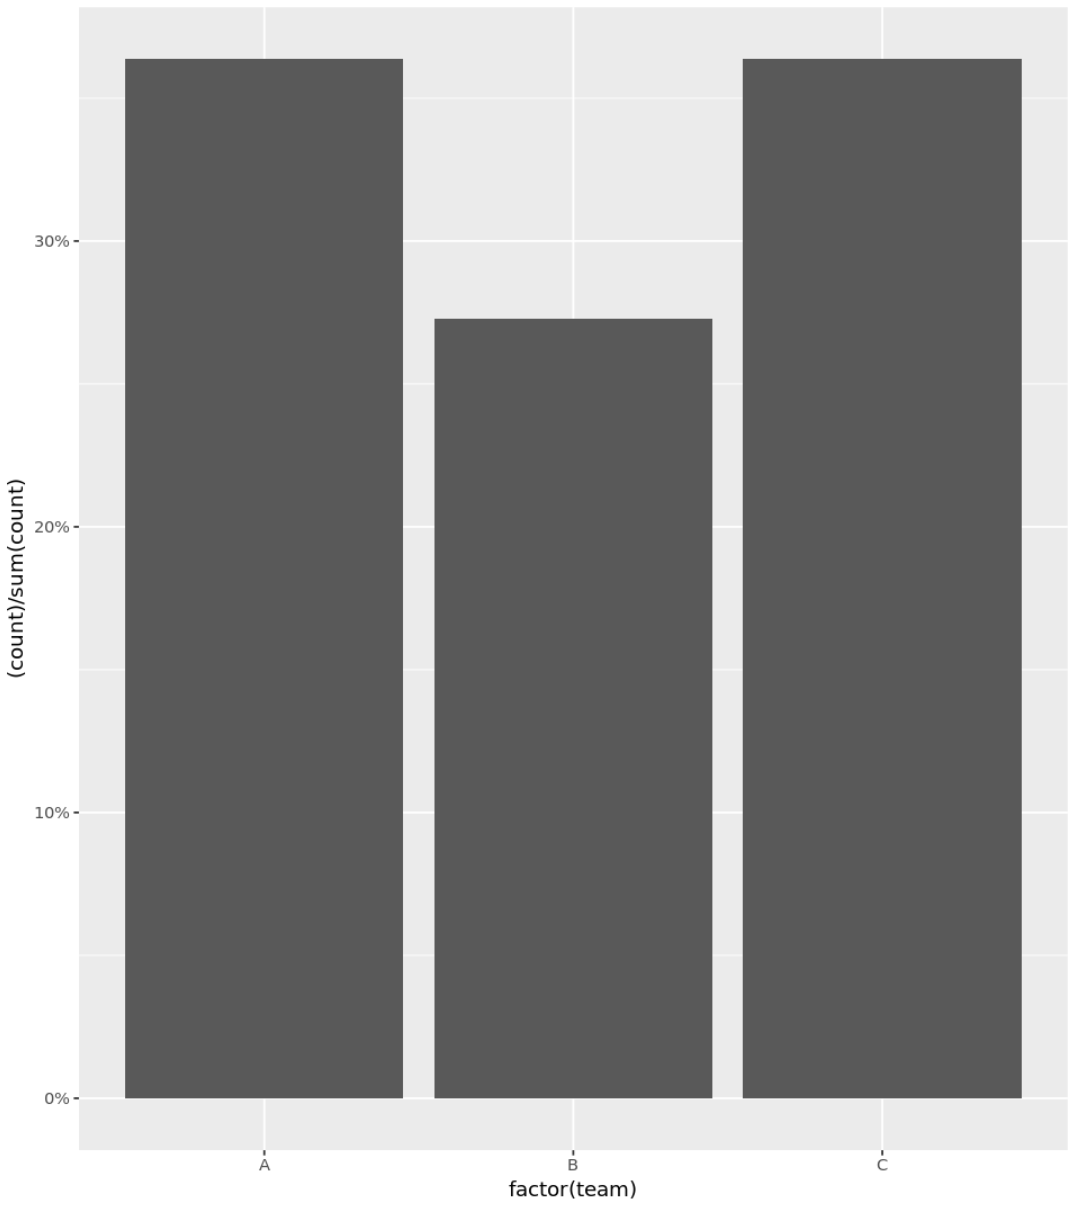
정밀도 인수를 사용하여 y축에 정수만 백분율로 표시할 수도 있습니다.
 library (ggplot2)
library (scales)

#define data frame
data <- data. frame (team = c('A', 'A', 'A', 'A', 'B', 'B', 'B', 'C', 'C', 'C', 'C') ,
                   points = c(77, 79, 93, 85, 89, 99, 90, 80, 68, 91, 92))

#create histogram with percentages
ggplot(data, aes (x = factor (team))) +
  geom_bar( aes (y = (..count..)/ sum (..count..))) +
  scale_y_continuous(labels = scales :: percent_format(accuracy = 1L ))

예 3: 백분율이 포함된 사용자 정의 히스토그램
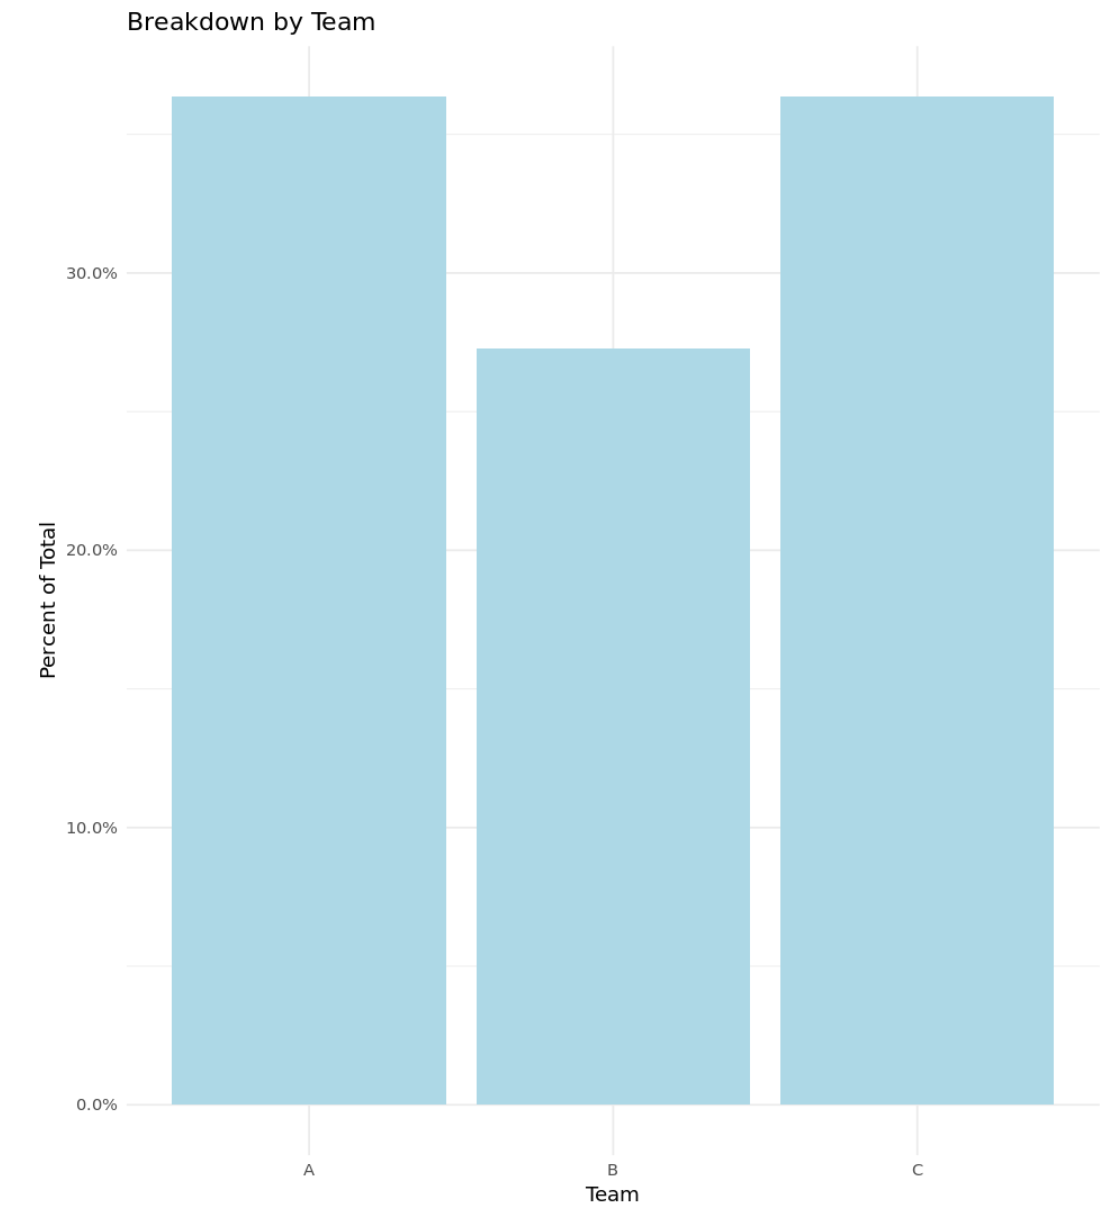
다음 코드는 Y축에 백분율이 표시되고 사용자 정의 제목, 축 레이블 및 색상이 포함된 히스토그램을 만드는 방법을 보여줍니다.
 library (ggplot2)
library (scales)

#define data frame
data <- data. frame (team = c('A', 'A', 'A', 'A', 'B', 'B', 'B', 'C', 'C', 'C', 'C') ,
                   points = c(77, 79, 93, 85, 89, 99, 90, 80, 68, 91, 92))

#create histogram with percentages and custom aesthetics
ggplot(data, aes (x = factor (team))) +
  geom_bar( aes (y = (..count..)/ sum (..count..)), fill = ' lightblue ') +
  scale_y_continuous(labels=percent) +
  labs(title = ' Breakdown by Team ', x = ' Team ', y = ' Percent of Total ') +
  theme_minimal()

관련 항목: 최고의 ggplot2 테마에 대한 완전한 가이드
추가 리소스
다음 튜토리얼에서는 R에서 히스토그램을 사용하여 다른 일반적인 작업을 수행하는 방법을 설명합니다.
R의 히스토그램에서 빈 수를 변경하는 방법
R에서 여러 히스토그램을 그리는 방법
R에서 상대 빈도 히스토그램을 만드는 방법